Put options on broad-based equity indices are systematically overpriced as measured by the expected profit of buying or selling them. Market prices for put options are usually higher than their Fair Values because of the volatility premium demanded by option sellers as compensation for high volatility and the potential for huge drawdowns. For more information, see this research: Are puts really overpriced?
However, since an expected value (all possible outcomes weighted by their probabilities) is always calculated as an arithmetic average, options Fair Values and their respective expected profit/loss do not reflect the compounding effect of returns. At the same time, we know that drawdowns have a negative impact on the total return if we capitalize all gains and losses (volatility “drag”), see more information in this post.
Theoretically, if an option seller bears this “drag”, a buyer, on the other hand, should benefit from removing this excessive volatility from his or her portfolio. In practical terms, with a long put option strategy as a hedge to a long equity portfolio, an investor can use the realized proceeds from put options at the time of a market crash as “dry powder” to buy more underlying assets at lower prices. This is also known as a “rebalancing bonus”, which is the opposite phenomena to the volatility drag.
In this research, we have studied whether put options overpricing is justified by this rebalancing bonus for a hedged portfolio. The results show that it is not. It turns out, there are no parameters (moneyness, DTE) of put options and put spreads that would make them an efficient hedge in the long run without predictions of market turmoils.
In this research, we look at SPDR S&P 500 ETF (SPY) in an attempt to discover if buying put options on it provides a good hedging vehicle against market drops.
As it was mentioned in the previous study about put options overpricing, there are various pieces of evidence exist confirming that put options on broad-based equity indices are permanently overpriced. We repeat here an example for 20 trading DTE put options on SPY for the 25 years period, from February 1993 to May 2018:
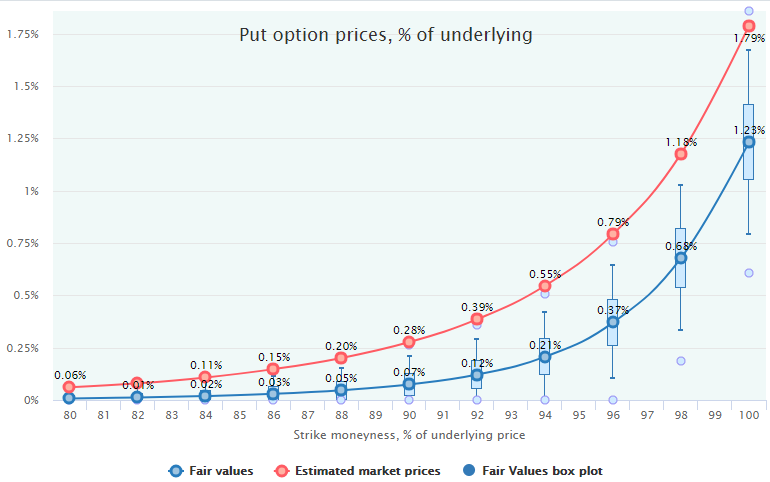
Obviously, put options are overpriced and this overpricing is statistically significant (almost all market prices are outside of the Fair Value 99% confidence interval).
Our regular publication of Options Mispricing Snapshots series also confirms that puts are almost always overpriced, especially in the OTM area. In contrast to call options, which are sometimes overpriced, and sometimes underpriced, but in most cases fairly priced, puts market prices are more often than not higher than Fair Values.
Moreover, thanks to our methodology, we can estimate options Fair Values for periods of time when options market didn't even exist or was not mature. Actually, we do not even need an options market to calculate options Fair Values (as an example, see this Bitcoin Options Fair Value research). This is a crucial advantage to our approach comparing to conventional backtesting, see Why OptionSmile is Better Than a Simple Backtesting
For example, to identify if put overpricing took place not only in the last couple of decades but also before, we calculated Fair Values for 1 month put options on the S&P 500 Index (SPX) for different 20-year intervals since 1950 until now (May 2018) with a 10-year step. Having done this, we get put option Fair Values for six intervals: 1950-1970, 1960-1980, 1970-1990, 1980-2000, 1990-2010, 2000-May 2018; each of them contains various stages of economic cycles and equity market states (bear, bull, etc.). Then, we compare these fair values with average market prices of puts on the SPY which we can estimate from our regression model and VIX (red line on the chart below).
Strictly speaking, these market prices can only be calculated since 1993 and are not fully comparable with the Fair Values derived from other periods, but this mismatch does not change the picture: puts Fair Values have never been higher than market prices in the last approximately 70 years. Find the similar analysis for 6-year intervals for the last 24 years here.
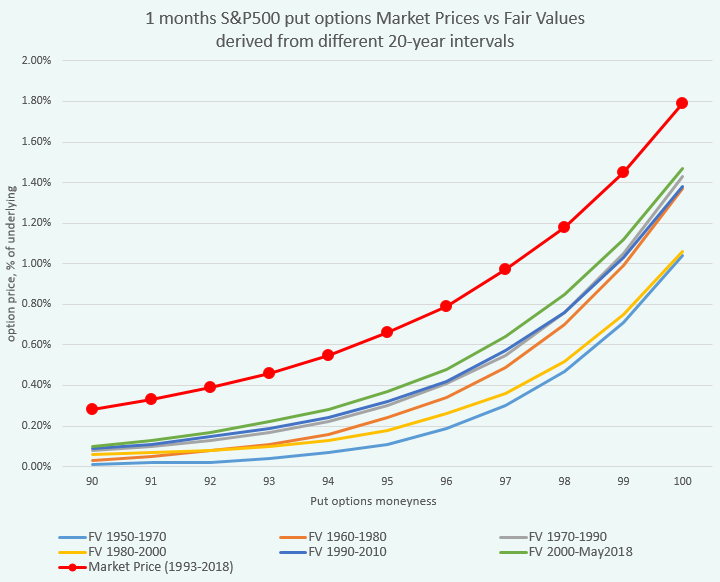
Interestingly, the last interval of 2000-May2018 has the highest put values which is likely due to the two recessions and severe bear markets, especially in 2008-2009.
Let's now look at the ability of put options to protect the portfolio in bad times. A hedging hypothesis might be the following:
True, puts are overpriced and for the most part, in a stable market (uptrend or rangebound) we will lose some money as they expire worthless. Yes, that will definitely put a drag on our portfolio returns during this timeframe but in the case of a market crash, we will compensate for all of these small losses from the very large price jumps of the put options we have regularly bought.
Moreover, the profit from these put options will provide us with "dry powder" to buy more equities at a lower price via rebalancing.
That theoretically will deliver a higher total compounded return in the end despite the mathematically expected loss of the long put strategy.
The OptionSmile platform provides tools not only for mispricing estimation but also a complete set of performance metrics for various options combinations (including multileg strategies). For many of them, it is also possible to include the underlying security and estimate the performance of the overall portfolio "overlaid" by the option strategy.
Let's look at the returns statistics of the SPY for the 20-day interval for the last 25 years (Feb 1993 - May 2018):

Notice the difference between the mean annualized return (red outline) and geometric average - CAGR (blue outline). This discrepancy (10.25% - 9.45% = 0.8%) is the abovementioned volatility drag. Theoretically, it should be lower if we eliminate big drawdowns with, say, long put options.
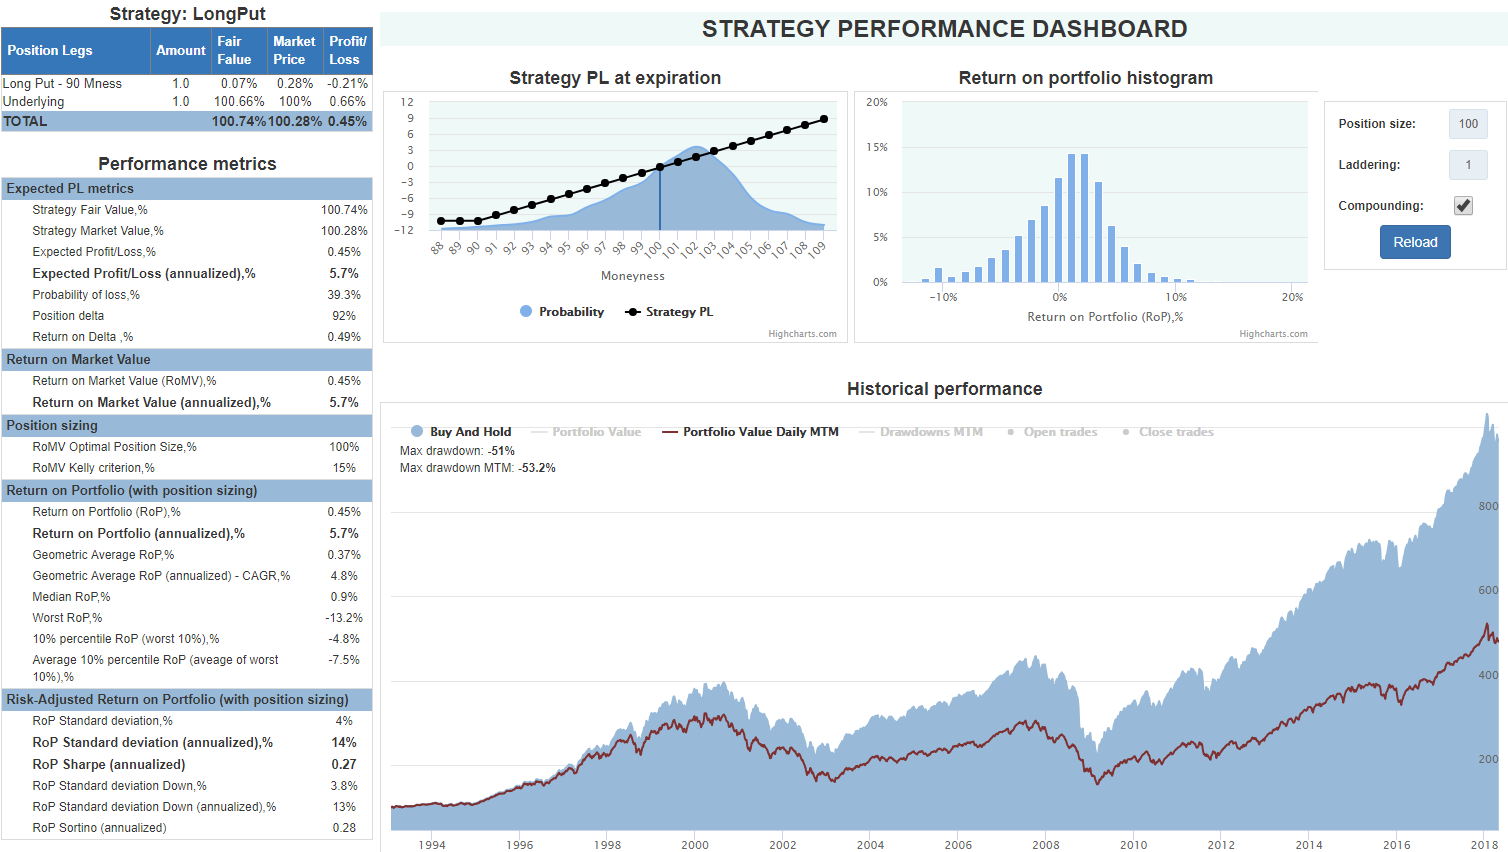
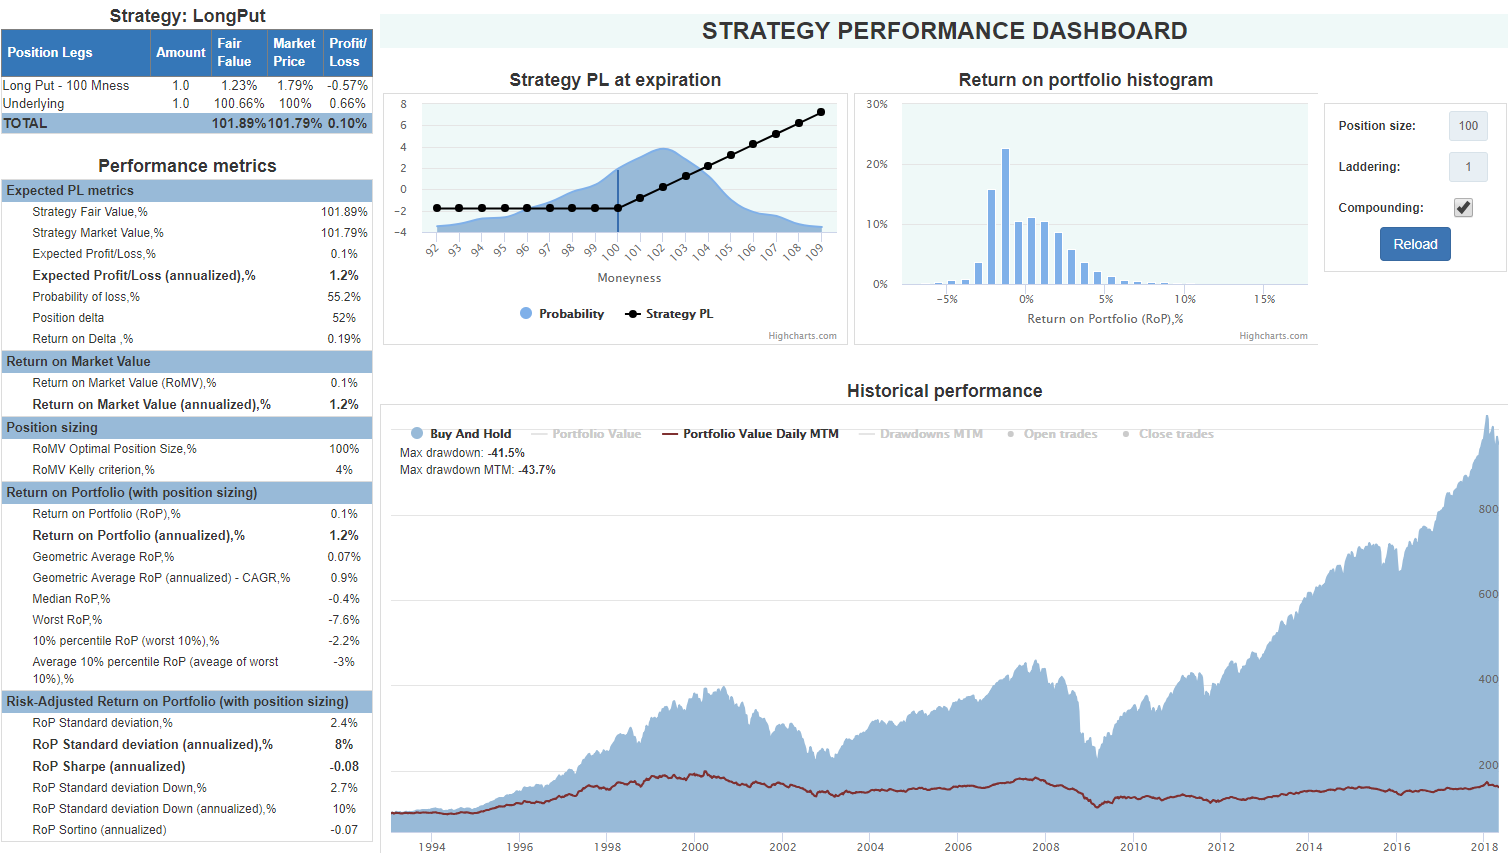
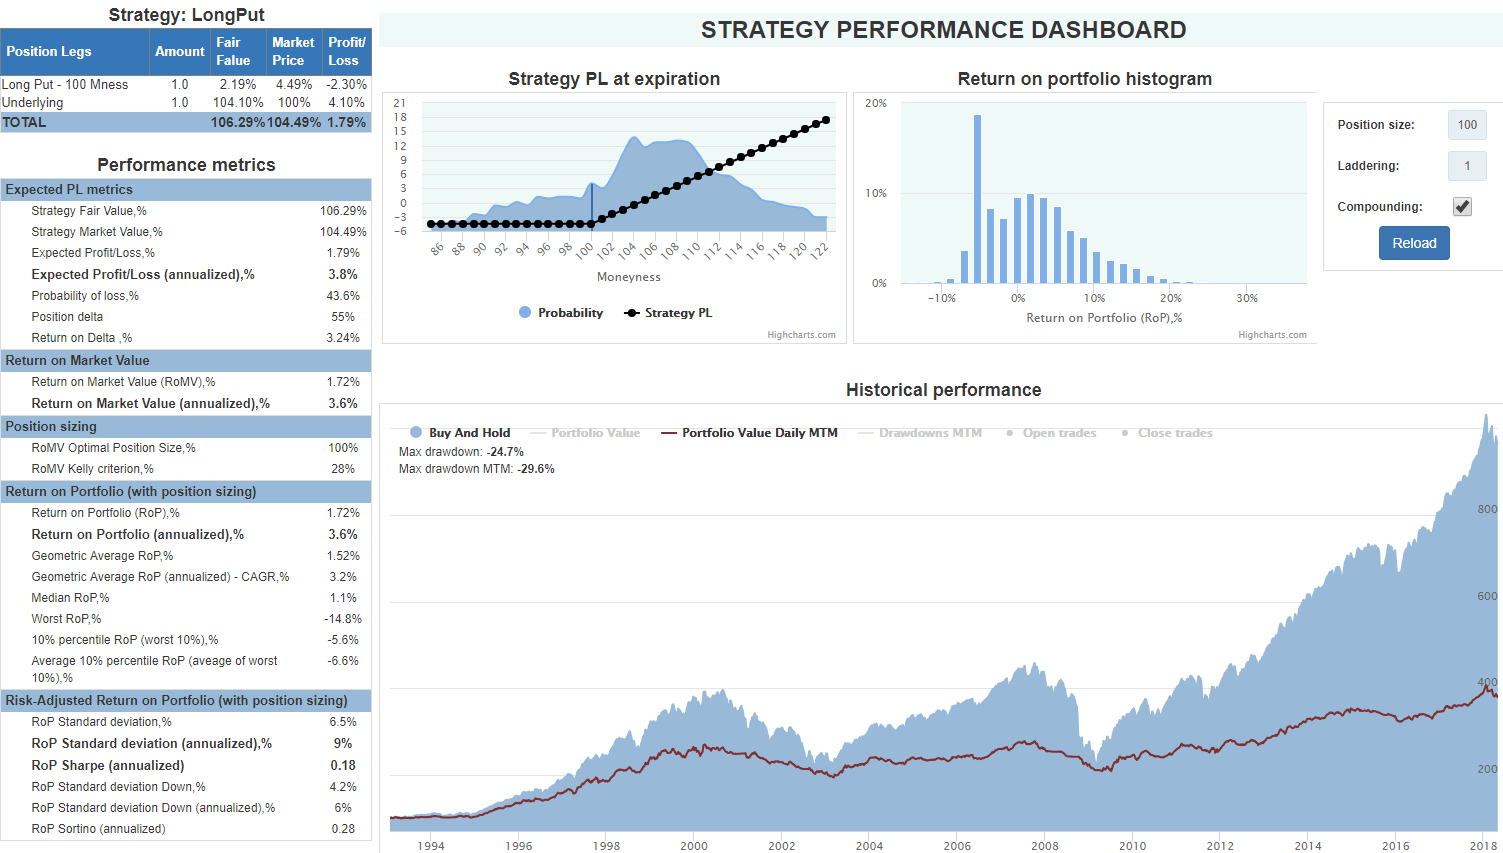
Here is the performance metrics for the SPY hedged by the long put "overlays" (DTE 20) for various moneyness:

Note: underlying returns are not exactly comparable to the strategy performance metrics because they are calculated based on Far Values which are, being the future expected payoff, discounted to be comparable with market prices. But it does not change the overall conclusion.
As we see, unfortunately, such a straightforward hedge actually deteriorates our performance. For each put moneyness, not only is the expected portfolio return lower (to be fair, we have anticipated this because the arithmetic average of the long put strategy has an expected loss) but geometric average - CAGR - also reveals weaker performance than a simple buy & hold strategy.
Obviously, the volatility drag is lower for the near-the-money strikes, but as it turns out the price of this insurance eats up almost the whole return on the underlying portfolio. Moreover, for the deep OTM options, the difference between Expected return and CAGR is even bigger than for a buy & hold strategy: 1% against 0.8%. These options make the compounded return even worse despite their low price.
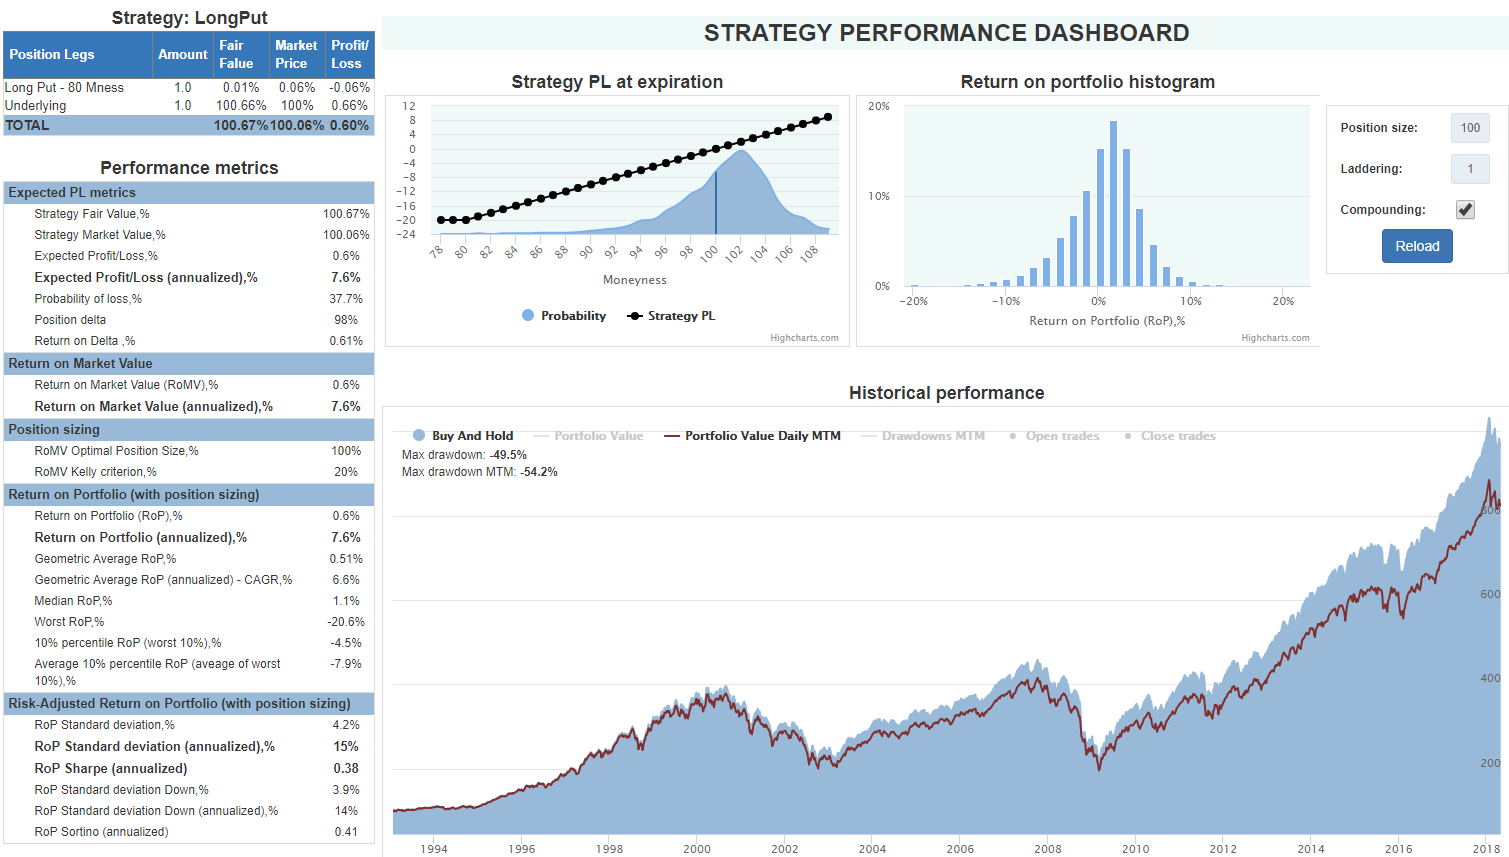
Below are the performance dashboards for three strategies for the SPY hedged by the long puts with 20 DTE and three moneyness: 80 (deep OTM), 90 (OTM), and 100 (ATM). All options are held until expiration when the next contract is bought with the same moneyness and DTE.
For other DTEs (40, 60, 120, etc.) results are conceptually the same for this 25 years period.
So, the conclusion is the following:
Simple mechanical buying of put options as a hedge deteriorates portfolio performance.
Farther OTM strikes do not provide enough protection while ATM strikes do suppress portfolio volatility but they cost too much to be efficient.
Let's look closer at these charts and zoom in the tough 2008-2009 period. Here are how these hedges worked in the 2008 crash:
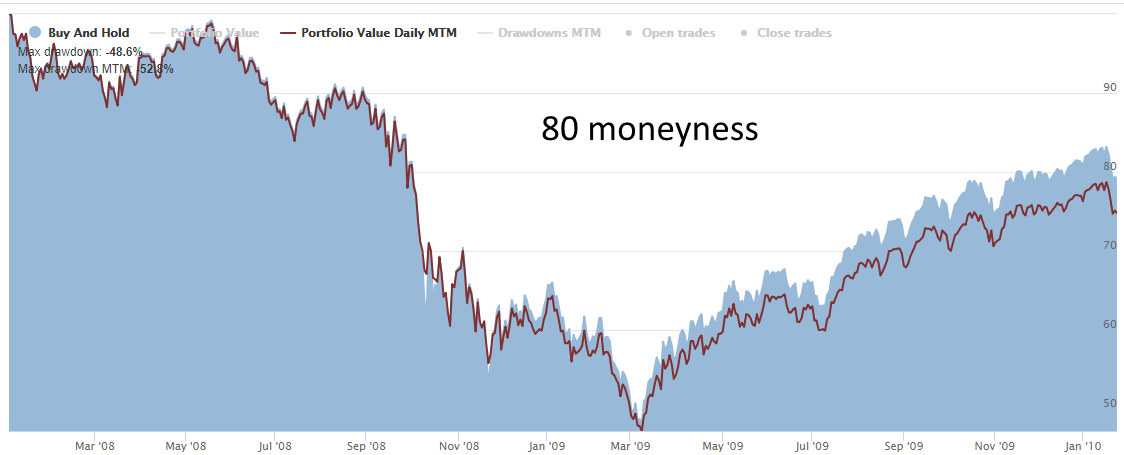
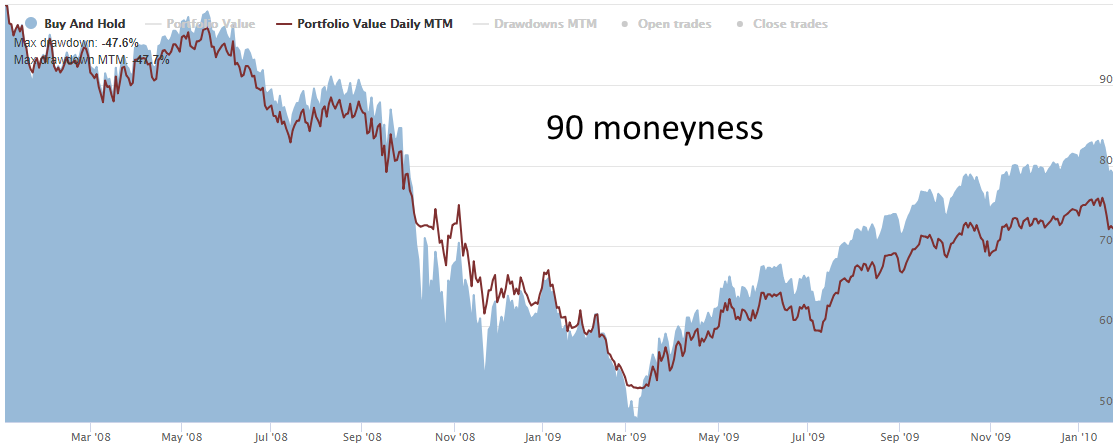
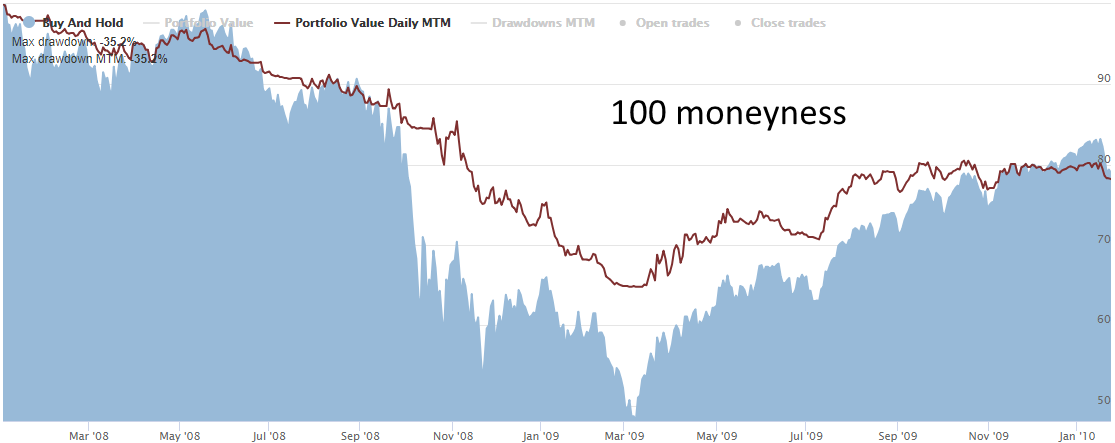
OTM hedging puts did not provide any meaningful protection against the crash of 2008 because of the need to roll them constantly. Although the puts often expired in-the-money and with rebalancing provided some "dry powder" with which to buy more stocks at a lower price, this "powder" itself, however, became very expensive during the markets fell off the cliff (up to 6% for the ATM monthly puts).
Longer term puts do a better job since they stand longer without rolling. But in the recovery phase, they drag the performance down. Here is the same 2008-2009 period for the portfolio hedged with ATM half-year puts (DTE 120):
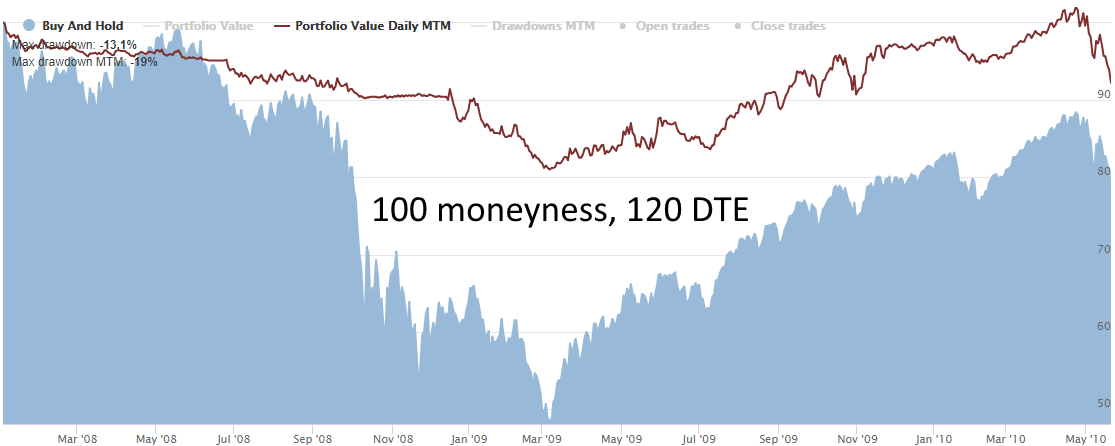
These puts did better in this turbulent period and did outperform buy & hold. The following, however, is how the same hedged portfolio performed during the entire 25-year range. Quite meager performance:
Thus, based on the above analysis, we conclude that there is likely no optimal regularly ongoing hedging strategy where directly buying put options at some fixed moneyness and DTE will outperform a buy & hold strategy in the long run.
It seems that the only way to stay hedged with put options more or less efficiently is to dynamically change the hedging strike (moneyness) depending on the mid-term market forecast.
For instance, if we do not expect a recession in the near future and believe we are in a healthy economy, we can decide to spend less on portfolio insurance and perhaps choose farther OTM put strikes, just against "black swan" events. Then, if we see the leading economic indicators deteriorating and thus increasing the recession probability, we can tighten our hedge and select strikes closer to ATM. In all cases, put options with more time until expiration likely work better (like, LEAPs).
A way to perhaps optimize the hedging performance is to not hold options until expiration but rather roll them earlier. However, as with held-to-expiration puts, we did not manage to find a strategy with early rolling that outperformed a buy & hold portfolio in this 25-year period.
We also tried different exit triggers: option price increase or decrease by some percentage, change of moneyness or DTE. While adding different rules did improve the portfolio performance sometimes, it was still below the efficiency of a simple long SPY portfolio.
A popular way to decrease the cost of hedging is to sell puts farther OTM to pay for the main hedging leg, e.g. to build a debit put spread. While this strategy does not provide full protection, it may represent a cheaper alternative.
The OptionSmile platform can easily calculate all the performance metrics for such a combination: Long SPY + Short Put + Long farther OTM Put. Let's look at monthly put spreads as a hedge for a long SPY portfolio.
Here is the annualized Return on Portfolio and CAGR metrics for the long SPY with overlays using the different combinations of short legs (horizontal axis) and the width of a spread (vertical axis). It is evident there is no combination with a performance superior to the buy & hold SPY portfolio, neither by arithmetic average return nor geometric average:

Here is the Sharpe ratio, which is also worse than for buy & hold portfolio:

So, our conclusion is that it is not possible to consider put spreads as an efficient long-term running hedge for an SPY equity portfolio either.