OptionSmile is not an options backtesting platform in a conventional meaning. Its methodology has some key distinctions from the typical way of backtesting:
Options Fair Value disregards the views of options markets on how much an option contract should have worth in the past. The only data required to calculate this value is the underlying security returns distribution – as a probability measure. This feature provides for more solid options mispricing estimation when the volatility skew and time structure (vol surface) deviate from their historical averages.
OptionSmile can provide the options valuation based on the time periods when the options market was not liquid, not mature or did not even exist. That gives us more historical data points and more robust estimations of an options strategy efficiency.
Avoidance of a “Sequentiality” Trap
Fair Value calculation refrains from the “sequential” approach used in a standard simple backtesting when each trade opens after the closure of the previous one. Instead, the Fair Value calculation concentrates on the statistical properties of the underlying security and takes into account each day in history and does not accidentally miss any significant market moves, which can be easily “jumped over” by a sequential backtest.
In this post, we take a closer look at these key advantages of the OptionSmile approach.
Let’s recall that according to the OptionSmile methodology, the options Fair Value is the mathematically expected payoff of a contract calculated on the basis of the historical distribution of the underlying security returns. One of the most important facets of this value is that it does not depend on the views and opinions of the options market participants, and, hence, that it is an “objective” option price to some extent.
Having that Fair Value, we can extrapolate it to the future and compare it with the current market price to find out whether our contract is overpriced or underpriced by the current market. In addition, with the Fair Value confidence intervals, we can figure out if this mispricing is significant or not. All that can actually be done without any need for historical options prices, which a conventional backtest would require. In other words, the Fair Value is “robust” to the historical option market prices, it is independent of them.
In practice, this feature is crucial for the mispricing estimations because of the “volatility surface” fluctuations over time. Very often, the shape of this surface (skew and term structure) deviates substantially from its average state in history, even in the same volatility regime. In such moments, if we backtest our strategy with those remote historical option prices, our results may be not applicable to the current market.
Here is an example of the put options mispricing for IWM with DTE 24 observed on May 29, 2018, 10:00 AM ET:
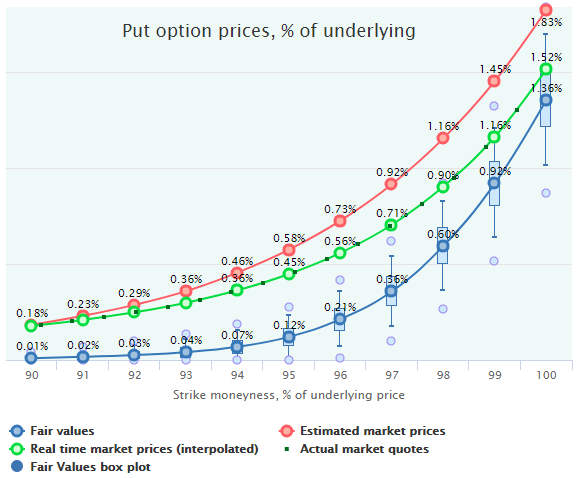
Put options obviously look overpriced (as usual) but the current prices (green line) in the at-the-money area lie much closer to the Fair Values than it has been observed in the past (red line). This means that at this particular moment on May 29, 2018, 10:00 AM ET, the options market was pricing the ATM puts lower than it historically did, making the current mispricing in this area not statistically significant.
If we just backtested the ATM puts selling in this regime, we would get a strong SELL signal right now. However, our true expected profit would be far from what a simple backtest produced. In other words, the current volatility skew differs from the historical one: the ATM area is located substantially below the level on which it used to be on average.
There is a lot of such evidence that exists when real-time market prices deviate from their historical averages, which our regular series of Options Mispricing Snapshots captures regularly. True, in most cases, market prices are close to their historical average in similar volatility regimes, but sometimes they diverge. Here is one more example for SPY calls on May 29, 2018 (DTE 24):

Historical prices (red line) almost coincide with Fair Values (blue line), and a conventional backtest would not signal any mispricing and profitable opportunities. However, at that particular moment, the options market was pricing these calls quite low for some reason making them a good candidate for buying.
A reader can find more similar examples in the Options Mispricing Snapshot series publication.
Actually, historical market prices are useful only to find out if an option contract was systematically over- or underpriced on average in history in different periods, market regimes, etc. However, a real trading decision should be made on the basis of the current market disposition. A typical backtesting approach is not capable of providing that kind of data.
Another advantage of the Fair Value independence from options market is the ability to calculate the expected profit/loss for the market regimes that did not show up frequently or when the options market was not liquid, mature or when it did not even exist.
For instance, we cannot now efficiently backtest an options strategy with short-term expirations (weeks) in the bear markets because the last two of them were in 2001-2003 and 2008-2009 when weekly options series did not yet exist. In a conventional backtest, we would have got just monthly series; say, for the period from November 2007 to February 2009 we had just 21 options expirations for SPY and the other most optionable underlyings. That leaves us with quite scarce data to rely upon when we want to backtest strategies with short-term options. These 21 market quotes for a single contract would not give us a reliable performance estimation of our strategy in a bear market (which will come inevitably in the future).
At the same time, disregarding the options market, we know how the underlying market behaved at those rough times. Actually, we had 333 trading days in this 16-month period and can take this dataset to build the probability distribution of underlying returns and calculate Fair Value of a contract with any DTE. By doing this, we get much more reliable insights about the market behavior in this regime and the respective Fair Value of an option contract. That will provide us with much more solid estimations of profit/loss of an options strategy when the market enters the same regime in the future.
Moreover, such an independence from the options market lets us calculate Fair Values based on the periods when the options market did not even exist. For example, we have the daily history of S&P 500 Index from the dates when options were not traded at all or were not as liquid as nowadays: 1960s-1990s. Even though that price data may be not so relevant today due to some structural shifts of the markets, the backtesting results based only on the last decade (one of the longest bull market) are not very reliable either. The same is true for the futures markets: commodities, metals, interest rates, etc.
Finally, we can even calculate options Fair Values for underlyings without options markets yet, for example, for cryptocurrencies (see Bitcoin Options Fair Values). Even it is not an easy task to filter out the regimes of these crypto-markets, we will be able to calculate the historical Fair Values for “crypto” options when they are finally introduced and estimate profit/loss for any options strategy. Obviously, no backtesting will be possible at that moment due to the absence of the historical options quotes.
Another key OptionSmile feature is the abandoning of so-called “sequential” approach usually used in backtesting platforms.
The typical way of backtesting is the following. While moving along the historical price series, a position is opened after some “entry” signal; then it is closed after an “exit” signal, and only after that, a new entry can be made. In other words, a new position can be opened only after the previous one has been closed. Some position “laddering” possible, but it complicates the analysis of results and is available not on many platforms.
All that generates a “jumping over” effect when the option positions can accidentally glide over some market drawdowns or peaks and expire (or close) on a favorable date when the market has bounced back. Several lucky jump-overs can completely distort the whole expectations about the strategy.
Here is the example of SPY price chart for the year of 2013:
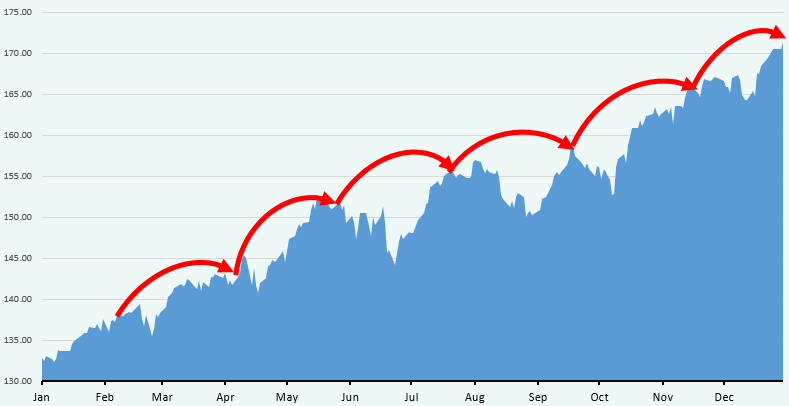
Red arrows are the theoretical option trades from open to expiration (around 1.5 months to expiration). Obviously, this is the extremely “lucky” row of opening and closing dates for any long-delta strategies like long call of short put. All the market drawdowns have successfully been jumped over and a strategy with substantial short gamma (and long theta) would look extremely profitable.
If we moved the starting point of this trading by 2-3 weeks forward or backward of cut the DTE to 3-4 weeks, we would come to another conclusion about any strategy performance: a lot of expirations would take place in the bottom of the market troughs.
To get more robust conclusions about the efficiency of a strategy, we have to look at the whole distribution of the underlying returns and not just of some small sample of the days that lined up in a sequence by chance. It is just one occasional path having quite low probability to repeat itself in the future.
The OptionSmile methodology derives the probabilities and expected values from the whole available data set: every day in history participates in both Fair Value and Marker Price calculation.
Of course, the OpionSmile methodology is not a universal panacea and has some limitations comparing to the conventional backtesting. As of the time of this post writing (June 2018), OptionSmile in its stable version is less flexible in some features than a sophisticated backtesting platform (at least, compared to those which allow for coding a strategy):
Despite these limitations, the presented methodology has an overwhelming advantage over the conventional backtesting approach.