
This section summarizes the various statistics of the underlying security returns for the selected time period and applied filters.
This chart depicts the actual (empirical) histogram of the underlying returns and its comparison with the normal probability density function having the same mean and standard deviation as the empirical returns have.
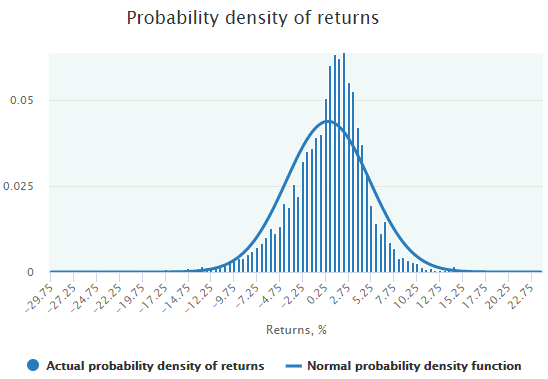
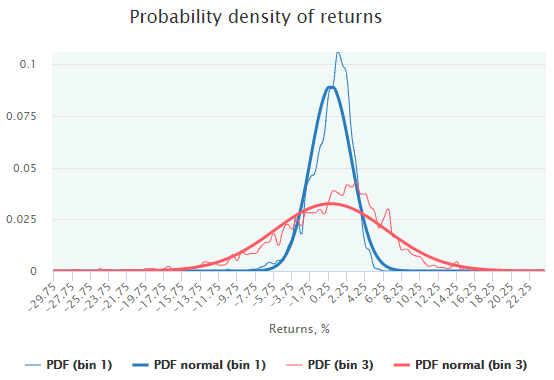
All the data in this chart pertains to the selected Filter Bin. If more than one of them is selected, this chart turns into the multiple bins mode and compares the probability densities for the selected bins.
Here is an example of the returns distribution charts of SPY for two Filter Bins:
This chart demonstrates the same data as in the Probability Density chart but in a cumulative form:
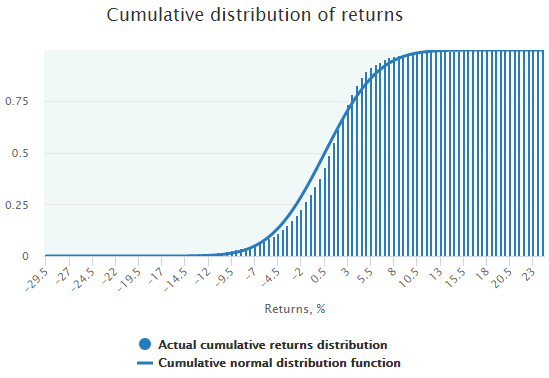
Multiple bins selection is also available.
This is a chart showing the wideness of returns distribution of all the bins calculated and presented in the Filter Bins table.
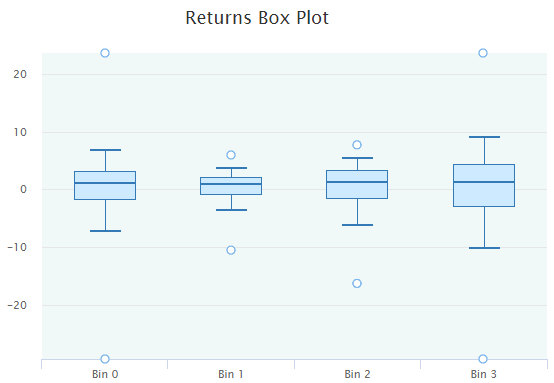
As with the options Fair Value, the body of a boxplot contains 50% of probability (between 25th and 75th quantiles), the area between the whiskers represents 90% of probability (5th and 95th quantiles). The only difference is in the upper and lower dots representing the actual minimum and maximum of all returns in the respective bin.
The last two diagrams represent the results of the test for the statistical significance of the difference:
for all the bins in the Filter Bin table.
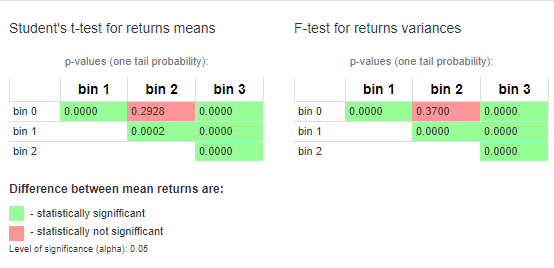
The Students t-statistics is used for the difference between the returns means. For the difference of the returns variances, the F-test is used.
Both tests evaluate whether the mean and the variance of the underlying security returns are significantly different among the Filter Bins. For this purpose, the one-tail probability (p-value) is calculated for all possible pairs of the Filter Bins.
The level of significance is set to 0.05 meaning that all the statistics above this value indicate that the difference is not statistically significant (highlighted by the red color).
All the data in this section is useful in searching for the distinct market regimes (bins) that stand out from other market conditions and have had significantly different statistics.