This section opens by default upon clicking on a Filter Bin and demonstrates the comparison of the options historical Estimated Market Prices, red line, against their Fair Values, blue line, with their boxplots reflecting the confidence intervals. All series can be turned off and on by clicking on the respective legend below the chart.
The right part contains all data for puts, the left part for calls. All prices are presented as a percentage of the underlying price (vertical axis) across the strikes, which are also relative to the price of the underlying security – in the moneyness terms (horizontal axis). The moneyness range and step are set up in the Control Panel.
Here is an example of the put options mispricing:
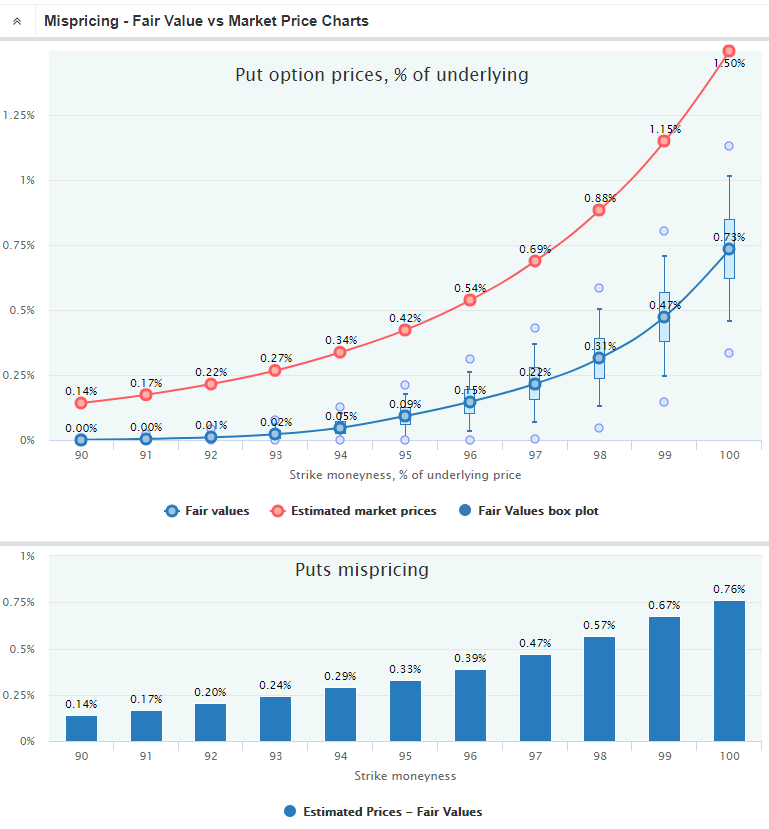
The lower bar chart demonstrates the difference between the Market Prices and Fair Values: positive numbers imply the overpricing, negative – underpricing of these contracts by the market on average in history.
The statistical significance of the mispricing can be estimated with the help of the Fair Values boxplot chart by comparing it with the market line. In the chart below, the call options are underpriced but not significantly since the market prices lie close to the Fair Values within the bodies of boxplots (50% confidence interval).
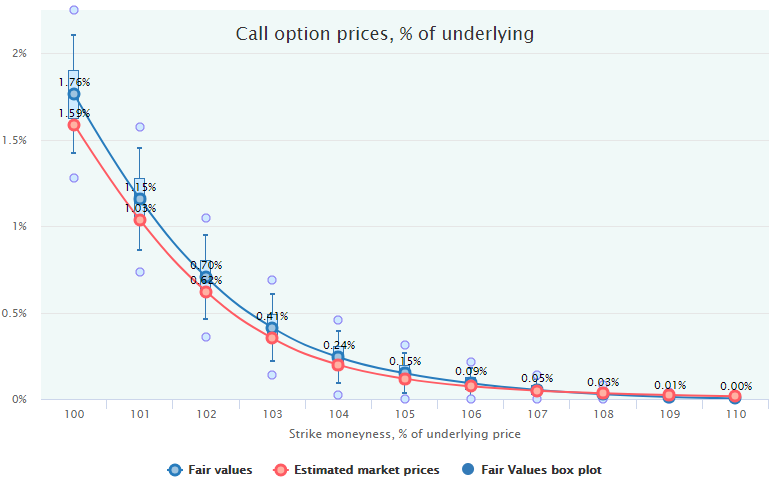
The boxplots wideness depends on the Sample Size parameter (n), which is set in the Control Panel.
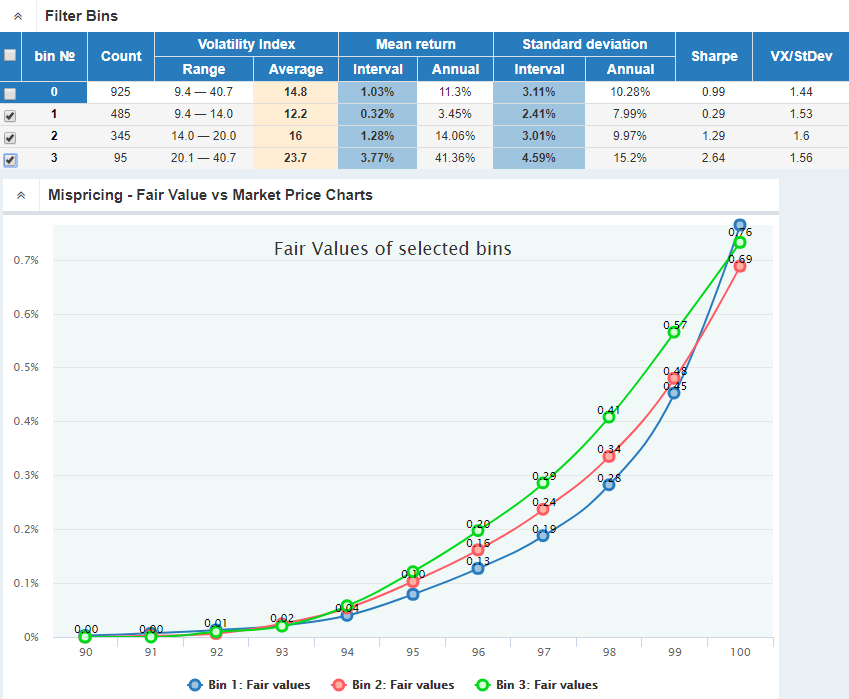
More than one Filter Bin can be selected by the checkboxes of the Filter Bins table first column. In this case, the charts demonstrate the comparison of the Fair Values of the selected bins.
Below the main mispricing charts, the Implied Volatility diagrams are located (collapsed by default), which demonstrate the σ parameters for the Black-Scholes formula corresponding to the respective Market Prices and Fair Values.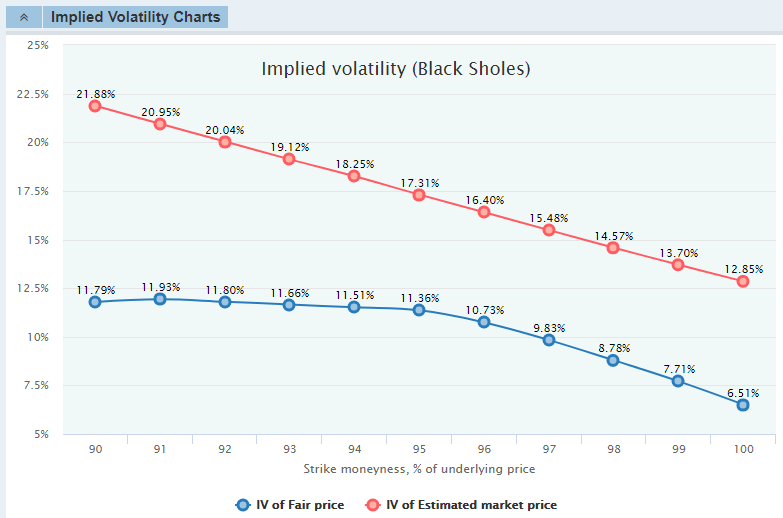
All the data for the charts are available in the table format. These tables, for puts and calls separately, are located under the Data Tables bar (collapsed by default):
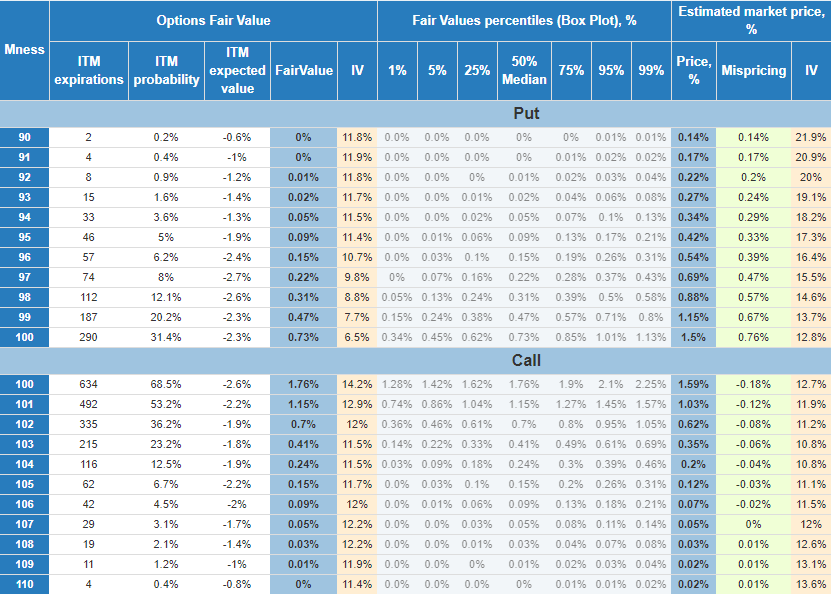
The columns of this table:
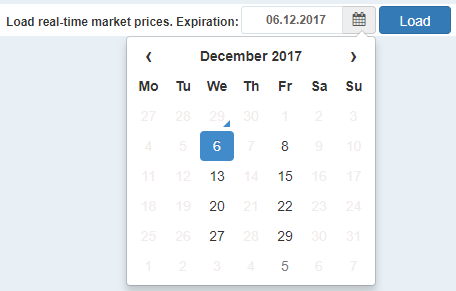
It is possible to load the real-time market prices to get the actual ad-hoc mispricing by comparing them with the Fair Values the same way as with historical prices.
The expiration date has to be selected from the control on the top right corner (only the currently available expiration dates can be selected):
Loading is available during the regular trading hours. In other times, the respective warning message will be displayed:
![]()
The process of loading the real-time prices takes approximately 20-25 seconds and two more data series are added to the main mispricing chart:
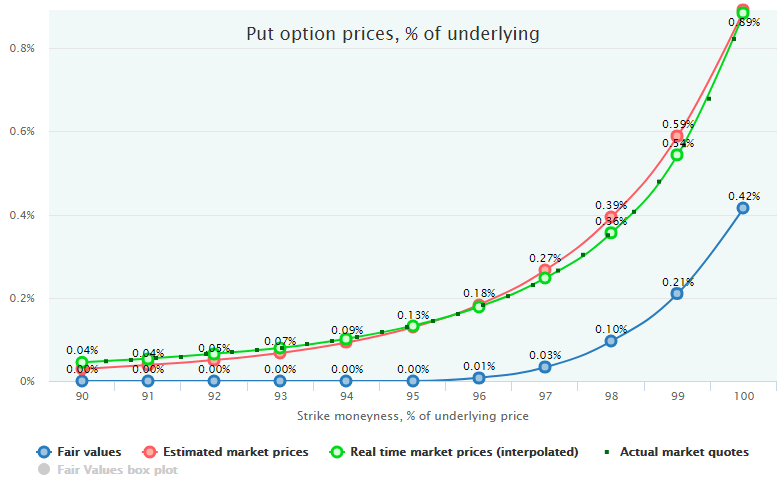
In most cases of the normal market condition, that green line of the real-time prices will be close to the historical prices (red line) if the average volatility index of the selected Filter Bin is close to its current level (see the Filter Bins table). Like in the above example.
However, in some conditions, these two lines can diverge even if historical prices are calculated for the dates with the average volatility index close to its current level. That means the current market is in some unusual rare condition with a volatility surface (skew/term structure) shape that has not been often observed in the past.
Obviously, in such a case, the actual trading decisions should be made on the basis of the current market mispricing, not on the historical one.
Hovering the mouse over an actual price point opens the detailed information about this particular quote:
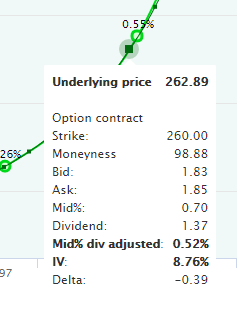
Note: if an underlying security pays dividends (has ex-dividend days) before the options expiration date, the options price is adjusted to this amount multiplied by the delta.
After the real-time prices have been loaded, the respective data appears in all other charts (Mispricing and Implied Volatility) and in Data Tables. Most of the strategies performance metrics also become available for the expected profit/loss calculated on the basis of the real-time prices.