This section opens when one bin is selected in the Filter Bins table. Its purpose is to visually control the results of filtering.
The main chart contains the underlying security candlestick series with the days of the selected Filter Bin highlighted by green dots. Below it, the charts of the applied indicators are shown with the respective range of the filtering indicators highlighted.
Here is an example of the Filter Bin 2 with RSI(14) in the 45-60 range, depicted below in the diagram in the lower chart.
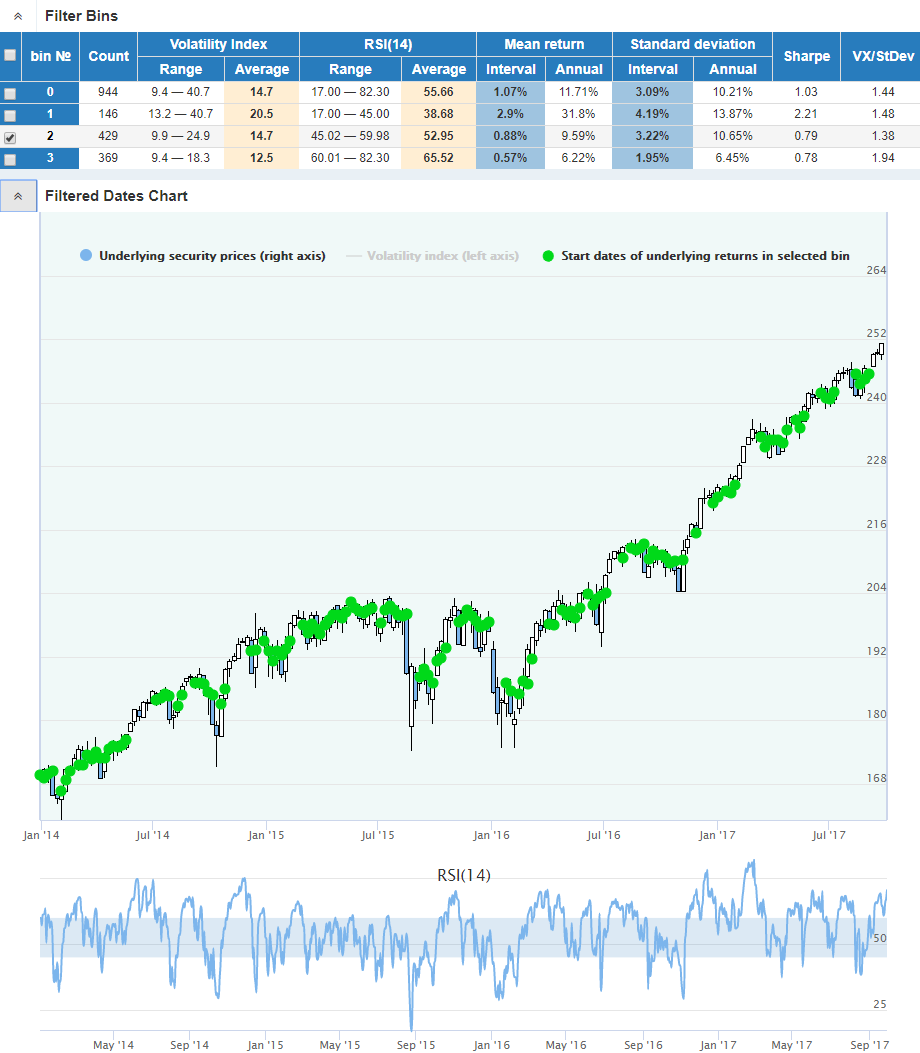
The green dots indicate the starting dates of the return intervals when the RSI(14) indicator was in the range of the selected Filter Bin 2: from 45 to 60. The main chart also contains the diagram of the Volatility Index (turned off by default).
That representation helps to control whether the filtered dates are evenly distributed along the whole time period or concentrated in a couple of unique moments. The second case would produce quite unreliable Fair Value and mispricing estimations not suitable for the extrapolation to the future. In the opposite, if the markets regimes occurred frequently in the past, they have good chances to repeat themselves in the future.