Control Panel is an area on the left part of the screen where all the preferences should be set before the actual calculation, which is initiated by pressing the Run button.
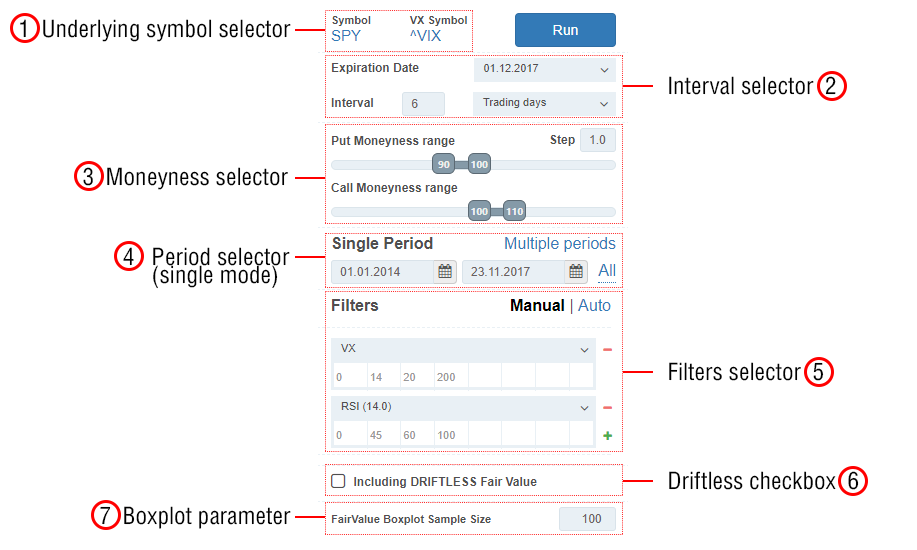
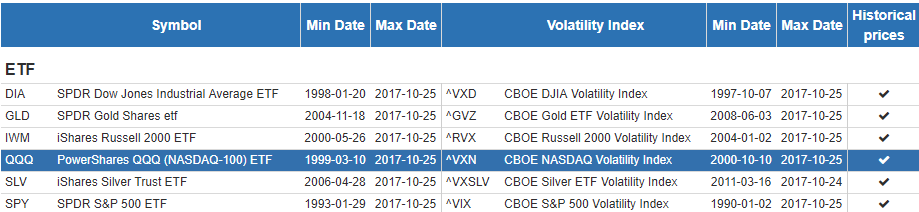
In the appearing window, choose an underlying security and the corresponding volatility index from the table:
Interval is a time period with the length equal to the days-to-expiration (DTE) for the option contract analyzed. All intervals are set in trading days, not calendar, taking into account all weekends and exchange holidays.
For example, if we are estimating the Fair Value of an option with DTE 20, we set the Interval value to 20-days, and the system will calculate all 20-day underlying historical returns. On that basis, both components of Fair Value will be calculated: the probability of ITM expiration in 20-days and the expected option value in such a case (see the methodology here).
For the convenience of choosing the Interval, this section also contains a dropdown list of all available expirations dates for the selected underlying security. After choosing a date from this list, an Interval is calculated automatically taking into account all upcoming weekends and Exchange holidays (but excluding the current date).
Moneyness is a ratio of the option Strike to the Price of the underlying security. It is expressed in percentage points, i.e., 96 moneyness means that strike is 96% of the underlying price.
In this section, the Moneyness range is to be set for the options which Fair Values and market mispricing are to be calculated, with the particular Step parameter. For example, by setting a moneyness range of 90-100 with Step 2, a user will request the following moneyness set:90,92,94,95,98, and 100.
For the purpose of the manual Market Regimes Filtering, it is possible to set the historical dates range on which all further calculations will be based. The whole filtering methodology and the respective examples are presented here.
Two selection modes are available:
In this case, only one period will be used with the start and end dates entered in the respective fields.
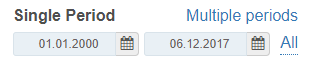
The All button automatically sets these dates to the maximum available range for the selected underlying.
In this regime, it is possible to slice the history into different non-overlapping periods, which can be grouped into some sets (such as Uptrends, Downtrends, etc.). All further calculations will be done only on the basis of the dates within these ranges.
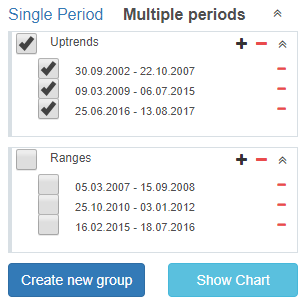
Any number of Groups can be created, and any time periods can be added to them. To visually control all these time intervals, it is possible to show a chart with the underlying security prices candlestick diagram (button Show Chart) on which all the checked periods will be highlighted by the horizontal green lines:
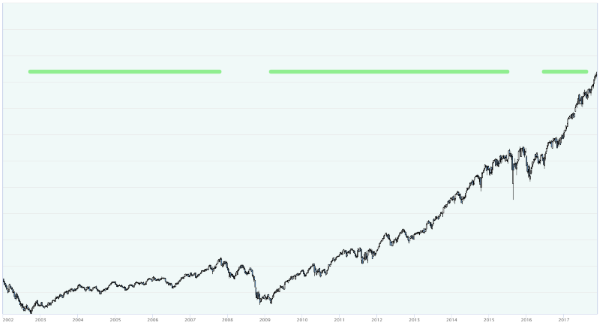
This chart also shows up automatically when a new period is added. Clicking on the chart adds a date into the field in focus.
This section is for the application of the indicator-based Market Regimes Filtering with various indicators such as Volatility Index, technical, or macroeconomic indicators, etc. All of them are available via the dropdown list for each filter (press + to add a new filter).
Two regimes of filtering are available: manual and auto.
![]()
Here, the filtering parameters (steps) should be set manually to allocate all the dates in historical range(s) into separate “buckets” called Filter Bins in the OptionSmile terminology.
For example, if the Volatility Index (VX) is chosen as a filter, its steps should be entered into the respective cells below:
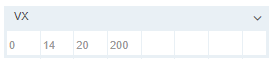
In this example, all dates in history (according to the Periods selector) will be allocated to three Filter Bins:
The options Fair Values, Market Prices, and all respective metrics will be calculated separately for each bin and presented in the Filter Bins table in the working area.
If more than one filter is added, the system will generate the Filter Bins for each combination of ranges of all filters. If, for example, in addition to the VX filter example above, we apply an RSI(14) indicator with 0-50-100 steps (two ranges: 0-50 and 50-100), the total number of bins – combinations of VX and RSI(14) ranges – will be 3*2=6.
In addition, the Filter Bin 0 is always calculated containing all the historical data without filtering.
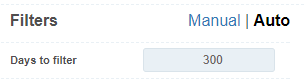
This regime automatically generates the steps for all selected filters by picking from the history those days in which all the filtering indicators had the smallest distance to their current value.
How many days in the historical dataset to select is controlled by the Days to filter parameter available in Auto regime (300 by default):
For instance, if the current VX value is 15, the algorithm will select 300 days when VX had the least distance to that value. The current value is automatically loaded during the main calculation cycle (Run button) and appears below the respective filter.
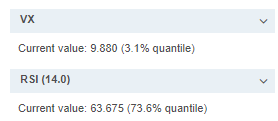
In addition to that, the indication of a quantile of the current value is presented, e.g., on what proportion of the total number of days the indicator had a value below the current one. In this example, the current VX (9.88) is quite low and represents just 3.1 quantile meaning that in the historical data range, which was set in the Period selector, the VX was below 9.88 in just 3.1% of all days. For the RSI(14), that indicator was below its current 63.675 value in 73.6% of days.
In case of the one filter application, the auto-filtering algorithm is straightforward: it just calculates the distances of the indicator historical values from the current one on each day, sorts them into ascending order and selects the top of them according to the Days to filter parameter.
When more than one filter is applied, those distances are calculated as a square root of the individual distances squared:
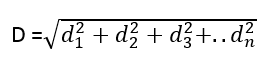
d1 – distance from the 1st indicator value, d2 – from the 2nd, etc.
This is the so-called Euclidian distance, which has a simple graphical explanation for 2 filters (click to expand):
This is an example of all combinations of VIX, horizontal axis, and RSI(14), vertical axis, for SPY for the 2010-2017 period:
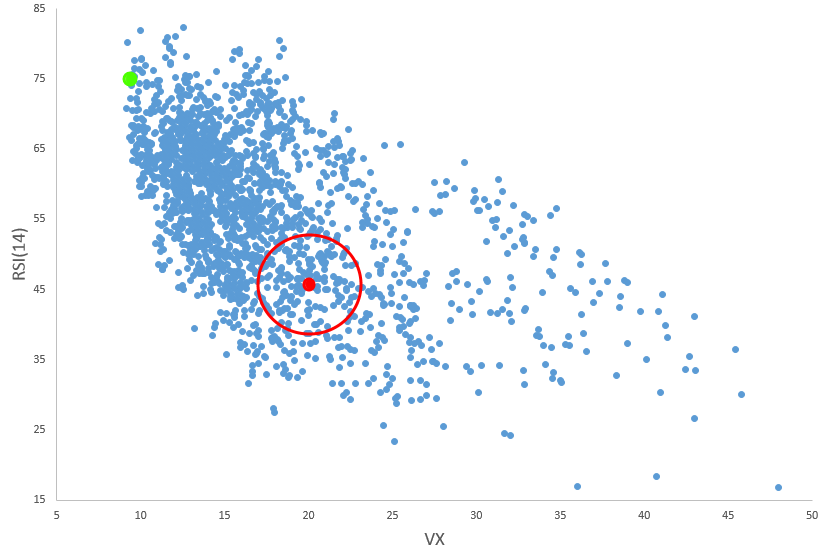
The red dot represents some conjunction of these two indicators (VX is 40, RSI(14) is 45) pretended to be the current market condition.
The auto-filtering algorithm will select the points that have the least distance to that dot. Actually, it will increase the radius of the circle around it until the necessary amount of days, set in the Days to filter parameter, is gathered.
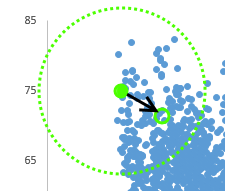
Important note: this auto regime should be used very carefully in case of some unique market conditions. For instance, if in this example we had some extreme values of VX, say 9, and RSI(14) of 70, we would have the current point on the top left corner of this chart – on the left edge of the “cloud.” Notice the green dot having not many neighboring points.
In this case, the algorithm will expand the circle quite significantly until it gets enough number of points. That will lead to the average values of both indicators (hollow green dot) that are quite different from their current values. The resulting filtered set of dates will not be a good representation of the current market conditions.
That is why all the results of auto-filtering should be checked and controlled manually in the resulting Filter Bins table appearing in the Working Area after the calculation. In such unique market conditions, it is advisable to expand the time period of analysis, decrease the number of applied filters, or just use the manual filtering mode.
It is possible to add or remove filters from the dropdown list (active filters).
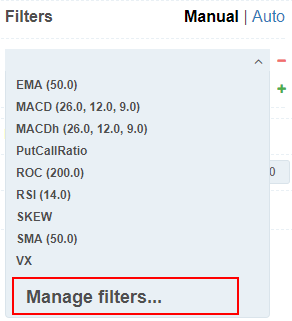
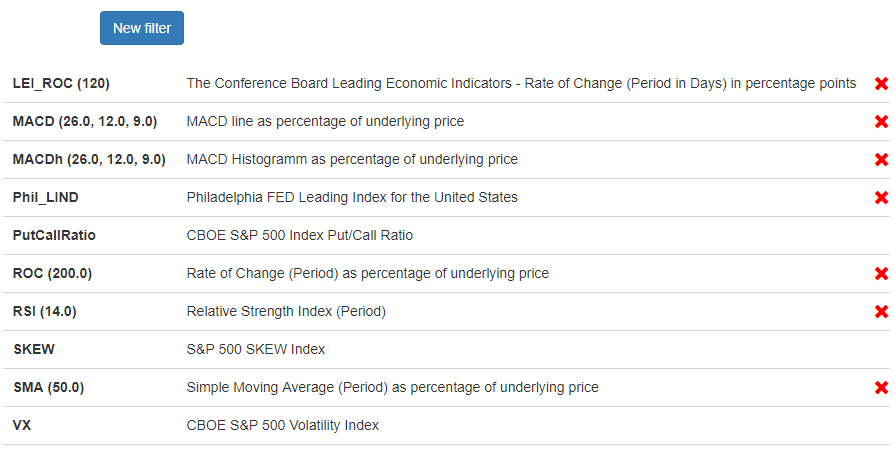
On the bottom, the Manage Filters element is located that opens the new window with all the active indicators listed, most of which can be deleted by pressing the x sign.
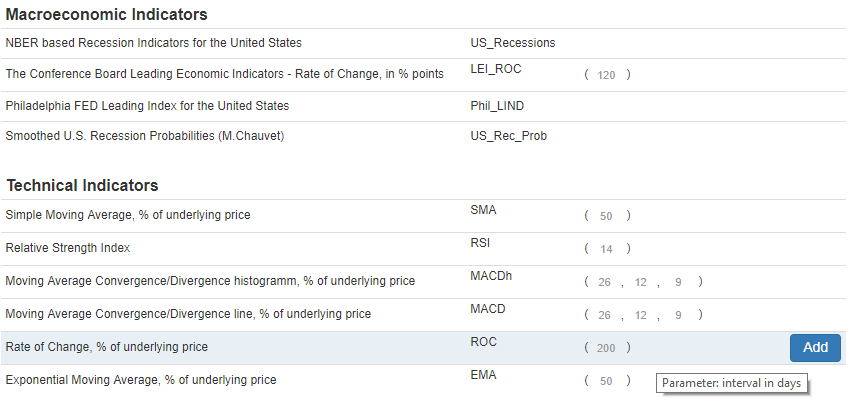
Pressing the New Filter button opens a window with all available indicators that can be added with custom parameters (description appears in the tooltips on mouse hover):
This preference requests the calculation of a Driftless Far Value series along with the regular one. For more about this approach, see the Driftless Option Fair Value post.
This series will be added just as a supplementary line in the mispricing charts.
However, all further calculations such as options mispricing, expected profit/loss, strategies performance metrics, etc. – will be based on the regular Fair Value, e.g., without the underlying drift elimination.
This parameter influences the wideness of the Fair Value confidence intervals, which are calculated analytically. This is actually an n-parameter in the Standard Error formula denominator reflecting the number of the future trades for which the Fair Value is extrapolated.