iPath S&P 500 VIX Short-Term Futures exchange-traded note (VXX), as many other similar volatility products, has been initially designed to provide an exposure to the volatility index on S&P500 – VIX. Being included in the long-term investment portfolio, this ETN was supposed to serve as a safety buffer during the market drops and, hence, should decrease the overall portfolio volatility enhancing the risk-adjusted return.
However, since VIX itself is just an index and is not tradable, VXX employs futures on VIX to replicate the desired exposure, and this changes the internal mechanics of this product completely. It demonstrates the positive dynamics only in the short-term – in times of volatility splashes, but during all other, more silent, periods, it is exposed to another very strong factor – volatility term structure. That phenomenon reflects the expectation of the market about the future VIX levels and is captured by the futures on VIX traded on the CBOE Futures Exchange (CFE). Most of the time, the VIX futures are in a contango (the near future price is lower than the further), and VXX constantly diminishes its value by the negative daily “roll yield”.
In this research, we have compared four strategies to exploit the constant downtrend in VXX: buying the inverse VIX ETN – XIV and buying the put options on VXX with different strikes (OTM, ITM, and ATM).
Long Put strategies look appealing due to the inherent downside protection that, theoretically, could lead to the superior risk-adjusted returns. However, the conclusion we have come is that both buying XIV and puts on VXX have almost the same performance measures by the Sharpe ratio, maximum drawdowns, and the shape of equity curves.
What VXX actually does is opening the long position in VIX futures and, to keep the constant measure of 30-day volatility, rolls this exposure every day by selling the nearest future and buying the next one.
In the normal conditions when markets are not in panic mode, the VIX futures have a "contango" structure with near-term futures trading lower than the farther ones. Here is the typical term structure of the VIX futures:
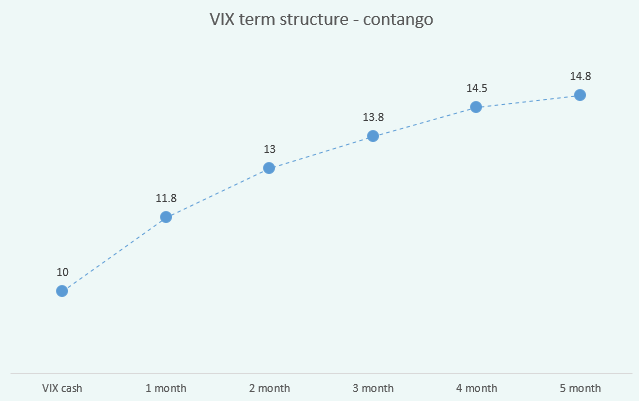
In this example, the current VIX (cash) is 10 while its futures are higher reflecting the market participants expectation of the VIX level in the nearest future.
This contango structure can also be considered as a volatility premium which hedgers are ready to pay to the risk-takers (VIX futures are often used as a hedge against the volatility). This phenomenon has the common roots with the put options overpricing.
To keep the weighted average maturity of 30 days, every day VXX sells a portion of the nearest (the cheaper one) future holdings and buys the same amount of the next (more expensive) future. By doing this, it gets the negative "roll yield" constantly. The only exception when this value is positive is the "backwardation" structure when the near futures are more expensive than the farther ones. This term structure takes place quite rare in normal conditions - only after significant market drops - and usually gets to the normal (contango) when the market settles down.
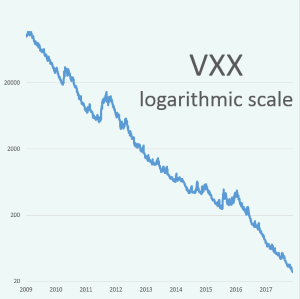
That negative roll yield is the primary source of the constant price decline of VXX. Here is the split-adjusted price chart with logarithmic scale:
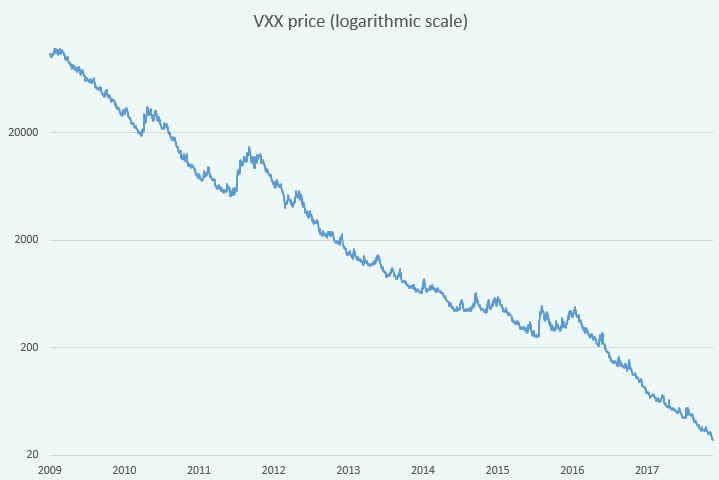
Obviously, with some interruptions, the value of VXX has been constantly destroying its value. That is why the holding of VXX in portfolios as a long-term volatility hedge it a bad idea. Nowadays it is well-known, but in early years, it was not evident for some investors and advisors who have eventually paid a price for such an advice.
Having that constant downtrend in VXX, there is an obvious temptation to exploit it somehow with a directional bet.
There are some inverse ETNs exist that do exactly the opposite than what VXX does: they short VIX futures and collect that positive roll yield. Why not just simply buy these ETNs to exploit the VIX term structure?
That idea is not as good as it looks at the first glance. Here is the price chart of the most popular inverse VIX ETN - VelocityShares Daily Inverse VIX short-term (XIV):
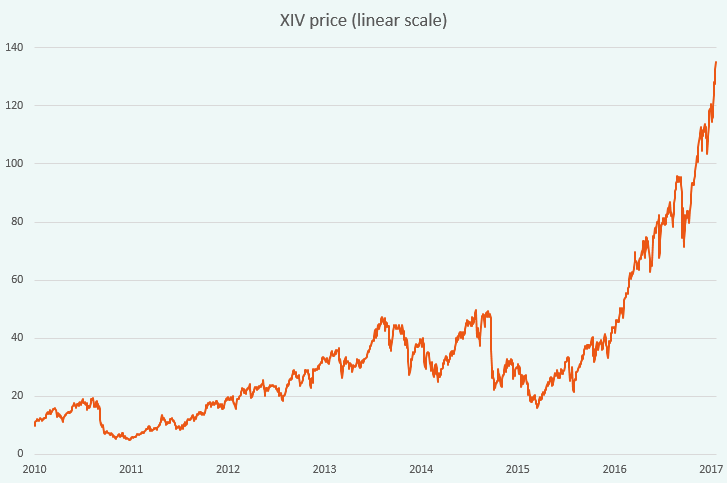
Obviously, even with the linear scale, it does not demonstrate such a directional stability as VXX does with its downtrend. Moreover, in some periods, long XIV positions can lose weight simultaneously with VXX.
For example, during the period of almost 3 years since Jan 2004 to Nov 2016 (up to the start of the Trump's rally), XIV earned nothing with huge swings. At the same time, VXX had lost almost 80% of its value:
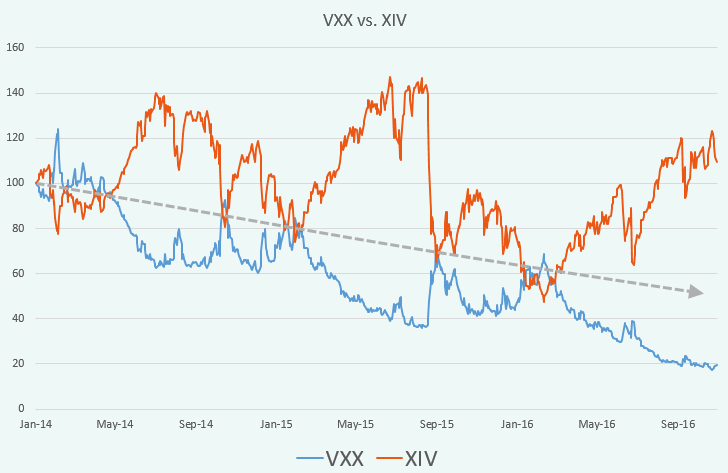
Notice the dashed grey line connecting the points when both products "met" each other if measured by the return since Jan 2014. Up to February 2016, both VXX and XIV had lost around 40% of their value.
Even during the steep uptrend in XIV followed the November 2016, up to December 2017, XIV increased in 3.7 times while VXX value dropped in 5 times (by 80%). For the whole period of XIV existence up until now (Dec 2010- Dec 2017) that difference is even more staggering: 14 times against 454 times.
The reason for such a diversion is the compounding math leading to the notorious "volatility drag". In spite of VXX and XIV having the daily returns correlation close to -1, the compounding of the daily roll yields of futures contracts does its grim work. Even if that roll yield had a zero mean (arithmetic), both VXX and XIV would lose money.
Here is the simplified example. If we had an initial portfolio value of 100 and two consecutive years of 50% return, we would get 100*(1+50%)*(1+50%) = 225%, i.e. our portfolio will increase in 2.25 times. When we had the same return but with a negative sign, we would get 100*(1-50%)*(1-50%) = 25% of the initial portfolio - the drop in 4 times.
Having the subsequent 60% drop in the first portfolio and the same gain in the second one, we end up with the loss in both portfolios: 100*(1+50%)*(1+50%)*(1-60%) = 90% and 100*(1-50%)*(1-50%)*(1+60%) = 40% respectively. Note, the first portfolio still has a positive arithmetic average return: (50+50+(-60) )/3 = 13.3%.
For more about the volatility drag and how to quantify it, see the respective blog post devoted to this mathematical effect.
So, to exploit such a dynamics riding the VXX downtrend seems more attractive than the XIV uptrend. The only problem is to find a proper instrument to do it. The direct short selling of VXX is quite difficult; therefore, let's find out if it is possible and efficient with options on it.
First, we have to find out whether the options market fully incorporates the VXX downtrend into the option prices.
Here is a comparison of the Fair Values vs Estimated Market Prices of 20-day (4 weeks) options on VXX for the period of Feb 09 to Nov 17:
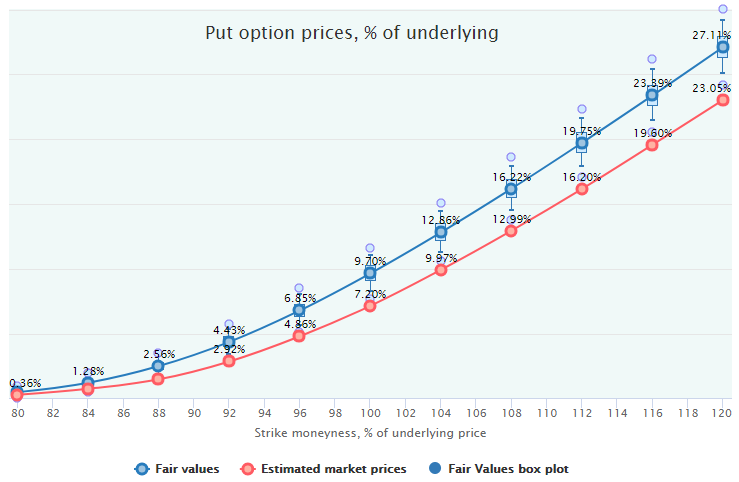
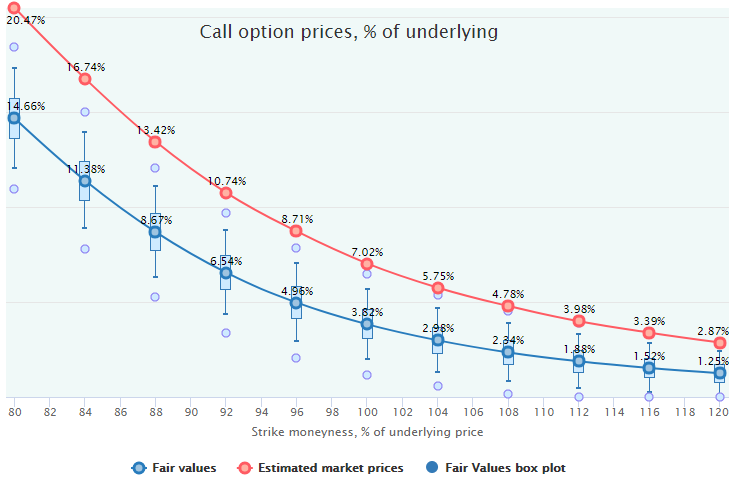
So, the VXX downtrend seems not to be fully priced by the options market: puts are underpriced, calls are overpriced. Therefore, buying puts and/or selling calls (call spreads at least) seem to be an appealing strategy.
We will leave the overview of the performance metrics of various strategies for another research and take a look just at one simple strategy - buying puts on VXX - and compare it with the outright buy&hold of XIV. Put options look appealing mostly due to the limited downside risk, at least in comparison to the long XIV, which has had quite significant drawdowns.
Since the XIV inception date is just Nov 29, 2010, we will also set the starting date for our VXX put options analysis to that point. This limitation will cut off one of the best performing periods for puts on VXX (Feb 2009-Nov 2010) when this underlying had dropped by almost 90%. It makes the following results more conservative.
Here are some key metrics across the strikes (moneyness) before the Return on Portfolio calculation:
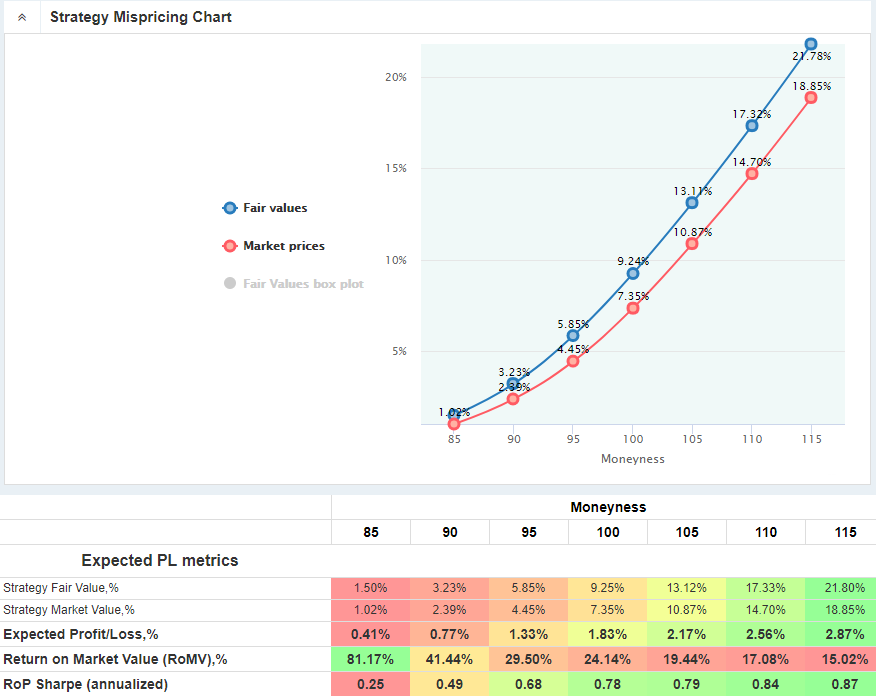
We see the ITM puts have the highest underpricing relatively to the underlying price. However, since they are more expensive, this mispricing relatively to their value (RoMV) is the highest in the OTM area.
Nevertheless, the risk-adjusted performance (Sharpe ratio) is the best in ITM options, but even there, that ratio is not very impressive and close to the Sharpe ratio of the direct XIV buying for this period - 0.85. At least by this metric, long put on VXX does not look superior to the XIV.
Let's now compare the equity lines of puts buying strategy with long XIV. To make them comparable we have to adjust the risk level of a put strategy by varying the Position Size parameter (the ratio of options Market Value to the total portfolio, in our case).
Since XIV is also volatile, let's take a reference portfolio with 50% invested in XIV and the rest is left in cash. That portfolio would earn around 29% of annual geometric average return (CAGR) for our 7-year period (Nov 2010 - Nov 2017).
This return will be our target to find the Position Size for the put options strategy. In other words, we have to find the Position Size parameter so that the strategy earns the same geometric average return and, hence, arrive at the same portfolio value at the end as the reference XIV portfolio.
Let's take three Long Put strategies:
It turns out that for the Put 85 strategy, it is impossible to find a Position size parameter to reach the same result as the reference XIV portfolio (CAGR 29%). The lower sizing does not put enough money at risk and earn lower results, the higher sizing leads to overbetting and loses too much during drawdowns. The best CAGR is 12% with the Position Size parameter of 4%.
The other two strategies can be compared to our long XIV portfolio. They get their Geometric returns (annualized) of around 29% with Position Size of 12% and 19% for ATM and ITM strikes respectively (they are not optimal, but we select the sizing parameters to get the final portfolio value the same as the reference XIV portfolio has).
Here is a comparison of all these three equity lines:
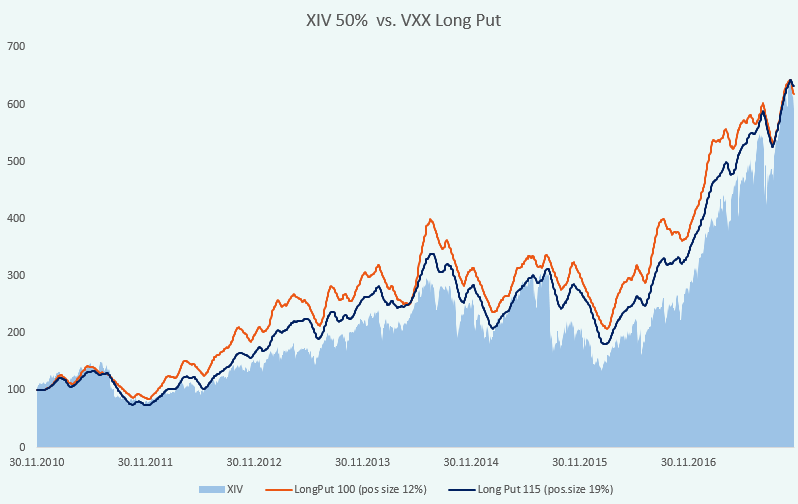
So, like with the Sharpe ratios, the VXX Long Put strategies do not demonstrate superior shapes of equity lines relative to the direct XIV buying. They also have huge drawdowns, just slightly less deep than XIV has, and long periods of poor performance.
Obviously, it is possible to increase the total return for these options strategies by increasing their Position Size parameters up to their optimal levels: 27% fo ATM and 40% for ITM puts having achieved the 66.2% and 58.4% of CAGR respectively. However, it is also possible to increase the exposure to XIV and get the similar results with almost the same level of risk (volatility and drawdowns). Remember, the Sharpe ratios of the VXX Long Put strategies do not differ significantly from the long XIV portfolios.
Therefore, taking into account the additional cost of buying options, time spent on it, bid-ask spreads and other, makes the strategy of simply buying the XIV more preferred than shorting VXX with put options.
Another conclusion is than nighter XIV nor VXX Long Puts are the "easy money". There were some rather long periods of rangebound markets (2011-2012, 2014-2016) with some steep intermediate downtrends.