
Options Fair Value is an expected payoff of a contract. To calculate it, we use some probability distribution of the underlying returns that we derive from the historical data. However, the key question here is whether the past data is a reliable source for predictions and can we base our investment decisions on such probabilities.
In this research, we use so-called “out-of-sample” technique to figure out if our methodology for finding Fair Values is a valid approach for predicting the future payoff of options. For that purpose, we chose some fixed Fair Value for a contract with some DTE and check if the average future payoff of this contract converges to the Fair Value that has been selected initially. By doing this, we avoid the “look ahead bias” in our calculation.
The results we have achieved are encouraging: the average payoff of option contracts demonstrates quite a good conversion to the Fair Value calculated on the past data. It is more stable for near-the-money and in-the-money contracts where the probability of ITM expiration is high and options expire in-the-money quite often. For the deep out-of-the-money options, which have fewer ITM expirations, this convergence is less stable (on the relative basis).
For the practical purpose, the outcomes of this study confirm the validity of the Fair Value calculation methodology as well as the estimation of the market mispricing and, hence, the expected profit/loss of a trading strategy in the OptionSmile platform.
To do this out-of-sample test, we simulate a process that resembles the real experience of a user of the OptionSmile platform. We use options on SPDR S&P 500 ETF (SPY) for our analysis. However, all other major US equity indices demonstrate very similar results: Dow Jones Industrial Average (DIA), Russell 2000 (IWM), Nasdaq-100 (QQQ).
To conduct our test, we select some days-till-expiration (DTE) for a contract (20 trading days as an example) and some fixed Target Fair Value as a percentage of the underlying price, say 1%. Then, for some recent time range, say from Aug 2013 to Aug 2018 (past 5 years), for each day - Test Date, we do the following steps:
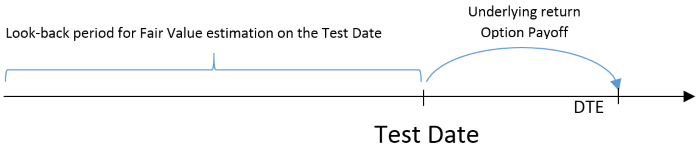
So, on the Test Date, we have moneyness of a contract with Target Fair Value and the following return of the underlying security for the same interval as DTE and, therefore, the actual payoff of this contract. We can call them the "ex-post" return and payoff, respectively.
By repeating these three steps for each day in our test time range moving forward (Aug 2013 - Aug 2018), we get the whole set of payoffs for the theoretical contracts with the same theoretical Fair Value that we initially had chosen (1% of underlying). Remember, on each Test Date we have this Target Fair Value fixed, so the moneyness of the contract varies depending on the market condition. Obviously, in high volatility regimes, this moneyness is lower for puts and higher for calls since ITM probability is higher and the selected moneyness must be more to the OTM area. The opposite is true for the low volatility regimes when the probability of ITM expiration is lower and the moneyness of our contracts is more close to the ITM area.
Finally, to check the validity of our Fair Value estimation algorithm, we look at the convergence of the cumulative average "ex-post" payoff to the Target Fair Value we initially selected.
Here is the visual evidence of convergence for the payoff of a put option on SPY with DTE 20 and Fair Value of 1% of the underlying price:
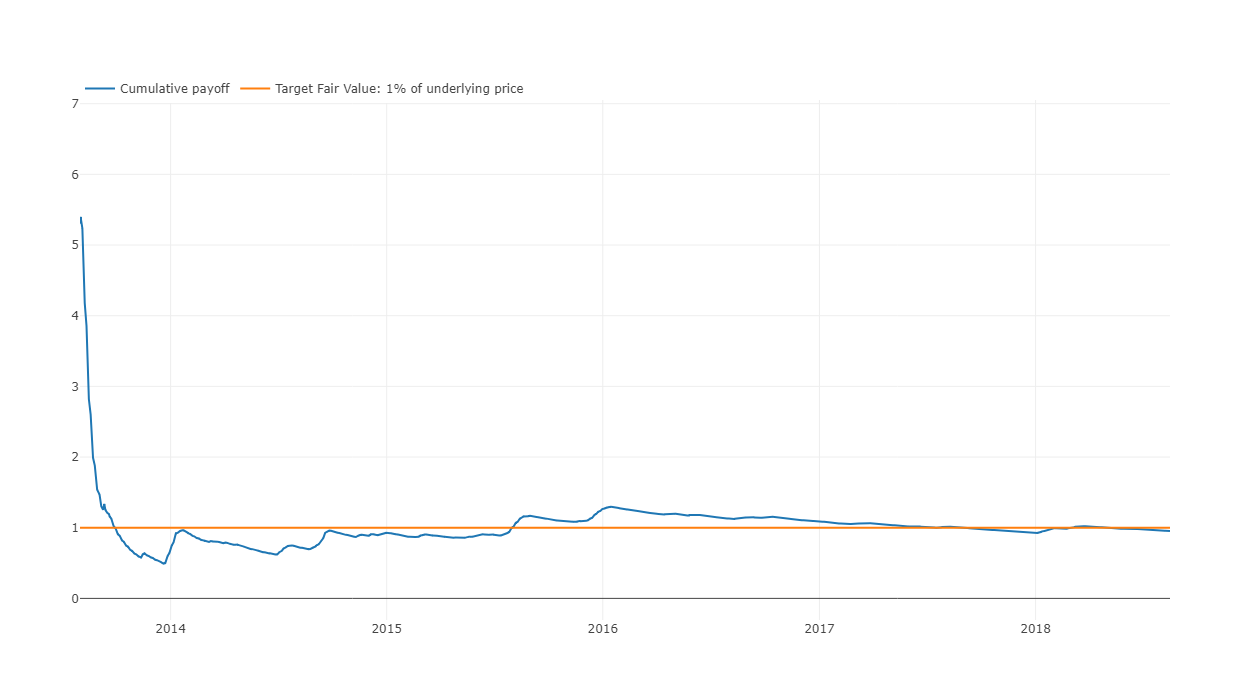
It seems our average (cumulative) payoff demonstrates quite a good conversion to the Target Fair Value, especially after some stabilizing period of the first several months. That means our algorithm of a Fair Value estimation does quite a good job.
Besides charting, we can also estimate quantitatively this convergence by calculating the average error - the ratio between these two values (Cumulative Payoff / Target Fair Value) - after some initial period, say, half a year since the beginning of the test period. For the example above, the mean Error ratio for this test is 0.995, which is very close to 1, with the standard deviation of 0.145.
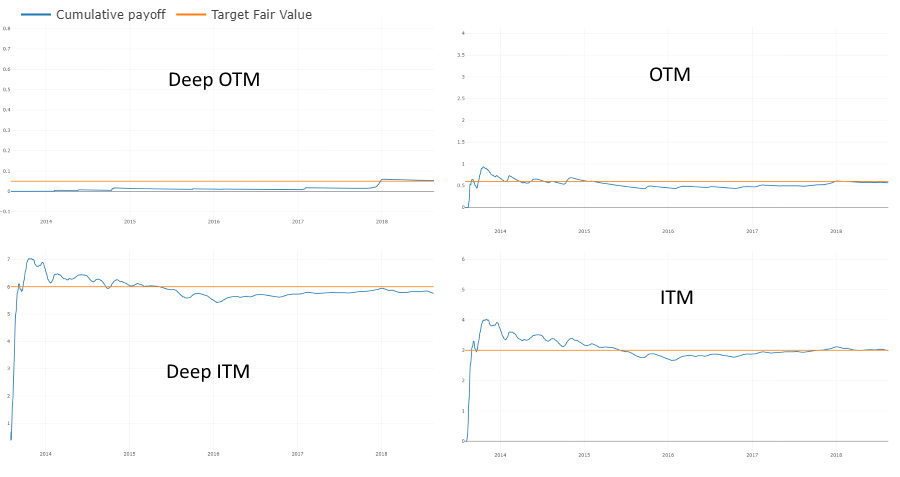
The average moneyness for this contract (20 DTE, 1% FV) is 100.7 which is close to ATM. Besides that, we can also look at four other put options for the same DTE: OTM, ITM, deep OTM, and deep ITM:
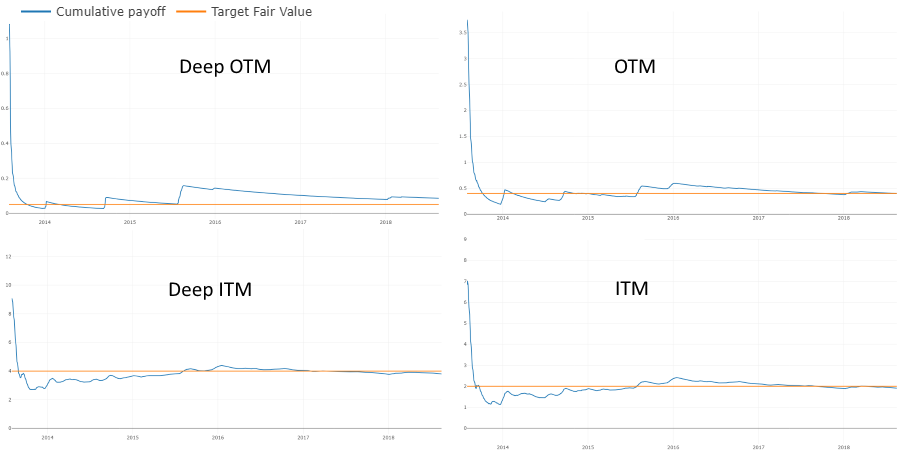
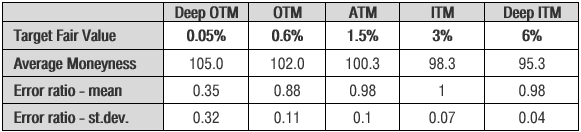
All of them also approach their Target Fair Values at a good pace. Here are the convergence metrics in the table format:

Note, on the relative basis, the more of-the-money an option is the less reliable our estimations become. For instance, for the Deep OTM options in this example, the Error ratio is 1.8 meaning that in 5 years this contract's average payoff missed its Target Fair Value by 80% (cumulative payoff is 0.09% instead of 0.05%). The reason for this divergence is that the Fair Value of such a contract is quite low in nominal terms and the probability of ITM expiration is very low: one extra expiration in-the-money can make a huge influence on the average payoff.
Nevertheless, all other contracts, from OTM to Deep ITM, demonstrate quite a good conversion metrics: average payoff fluctuates somewhat around the Target Fair Value but finally converges to it.
For call options, the results a very similar. Here is an example for the ATM calls on SPY with DTE 20 and Target Fair Value of 1.5% (100.3 average moneyness):
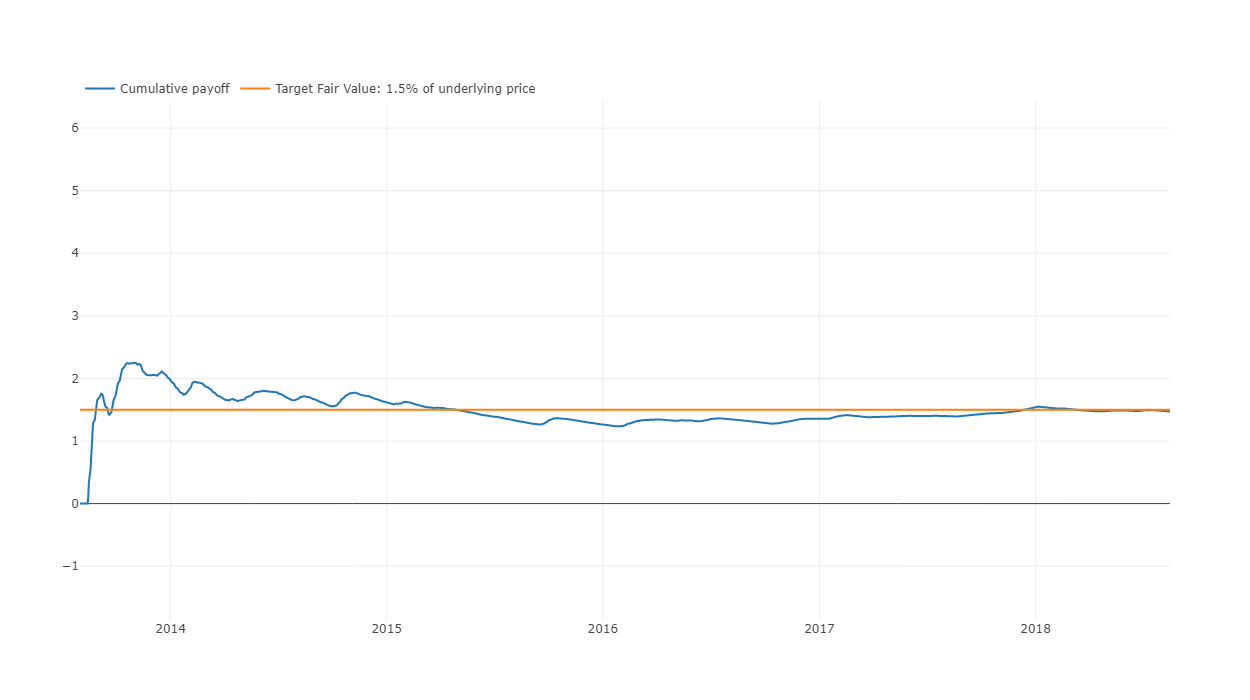
As with put options, quite a good conversion to the Target Fair Values is observed. Here is the same analysis for the call options with different moneyness:
Again, we see not so pleasant results only for the Deep OTM call options (with low Fair Value and ITM expiration probability) while all other contracts have quite a good convergence metrics.
We have also run the similar tests but without market regimes filtering. The outcomes are much worse than the results presented above: error ratio is huge with quite substantial standard deviation, OTM options payoff does not even converge to the Target Fair Value. Therefore, applying filters for market regimes is essential for the reliable estimation of Fair Values and market mispricing.
What are the practical outcomes from this theoretical exercise?
A good convergence of options payoff to the Fair Value based on the historical data is a good sign that the past data can be not so bad predictor for the future, at least if we filter for the macro and volatility regimes. In other words, when we select from the past only the dates with the market condition similar to the current one, our probability estimations can be quite reliable.
Simply put, when we look at the current market mispricing (Market Price vs Fair Value) and expected profit/loss of a strategy in the OptionSmile platform, we can be sure that at some point in the future our average result per trade will finally converge to the expected profit we have initially estimated. Except for the Deep OTM options.
The speed of this convergence directly depends on the wideness of the Fair value confidence intervals, of course.
Moreover, as out Fair Value calculation is independent of the options market, this test also does nothing with the historical options market pricing and depends only on the behavior of the underlying security. That feature makes this approach much more robust than the one where we take into account the historical market prices for options. For more, see the post Why OptionSmile is Better Than a Simple Backtesting.