
All the material presented in these methodological articles, but with more details, can be found in the book Option Fair Value: Finding a Statistical Edge in Options Trading. A free copy is available for registered users.
The options Fair Value is a statistical estimation — a mathematical expectation of a price at which both a buyer and a seller have zero expected profit. The key term here is “expected,” which is not the same as “guaranteed”; therefore, as a random variable, this value tends to converge to its expectancy only in the long term. The less variance it has, the faster such a convergence realizes.
In this article, an approach to estimate the variability of the options Fair Value is presented. It helps to find out how
statistically significant a market mispricing currently is
or has been in the past.
The OptionSmile methodology calculates the Fair Values of an option contract as a single number for each strike (moneyness) on the basis of some amount of filtered returns in a dataset – Filter Bin. The difference between this number and the market price constitutes the expected profit or loss. However, such a point estimate needs some assessment of its reliability. Namely, we need to ensure that, after some number of trades in future (some of them will be profitable, some losing), we will arrive at the value we expected, on average.
One way to estimate the reliability of any statistic is to build a confidence interval for it with a predefined confidence level. In other words, we would want to know some range, within which our “real” Fair Value will fall with some probability (50%, 90%, 99%, etc.) after some number of trades in the future. The wider this range, the less reliable our Fair Value and market mispricing estimations are.
The Fair Value confidence interval is a range bounded by the quantiles — values below which our Fair Value will be with some probability. This concept is quite simple and intuitive.
Let’s say, for example, we have calculated the Fair Value of an option contract — 1.5% of the underlying price. Then we have found Q25 (25th quantile) equal to 1.3% and Q75 (75th quantile) equal to 1.7%. That means that in the future we can expect our Fair Value to fall below 1.3% with the probability of 25% and below 1.7% with the probability of 75%. The range between these two quantiles (1.7% and 1.3%) constitutes the 75%-25%=50% confidence interval.
In other words, we do not expect our Fair Value to be strictly 1.5%. That would be too over-confident, and, mathematically speaking, the probability to get the exact number of 1.5% is zero. Instead, we will expect it to fall within the range of 1.7% and 1.3%with the probability of 50%.
Any other intervals can be calculated in the same way – with the help of quantiles 5%, 10%, 90%, 95%, etc. – and represented in the form of the so-called “box-and-whiskers” plot or simply box plot. Here is the one used by the OptionSmile platform to represent a Fair Value of an option.
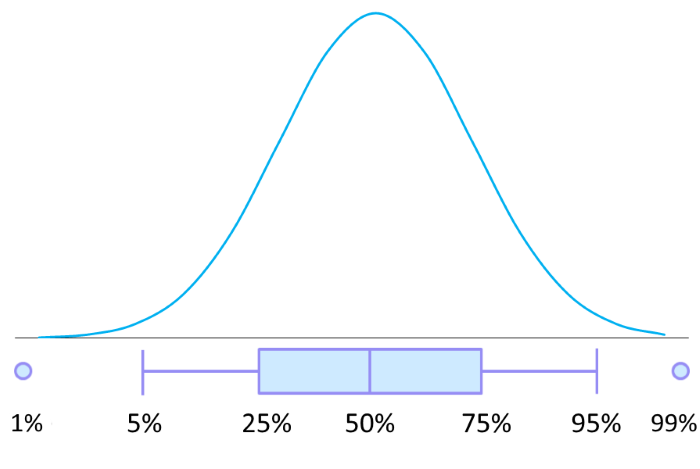
The body of the box is bracketed within the 25th and 75th quantiles — the 50% confidence interval. The “whiskers” contain a 90% confidence interval between the 5th and 95th quantiles. The interval between the dots comprises a 98% probability.
The series of these box-plots can be placed on the Fair Value chart to represent its variability. For example, here are the Fair Values of the monthly put options on SPY for the period 2000–2016.
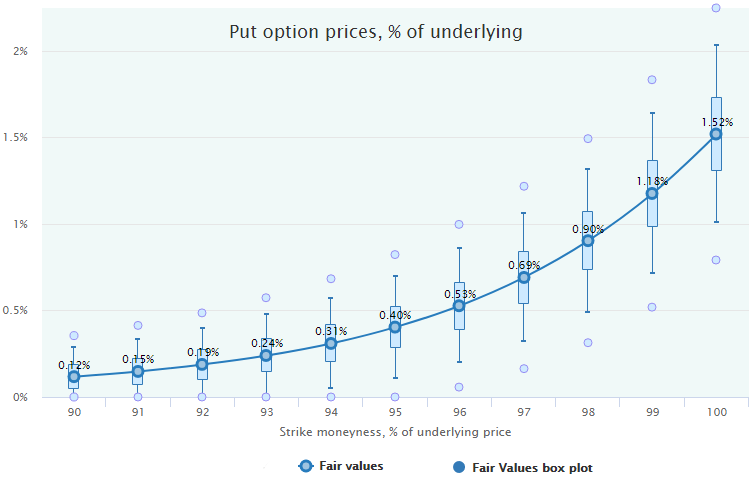
So, we have not just a point estimation of the Fair value for each moneyness but the representation of their distributions and confidence intervals. That, in turn, gives us an instrument to evaluate a statistical significance of the options market mispricing
Here is an example of two short-term market regimes for 2-week call options on SPY with 20-year historical range of October 1997 to October 2017, without volatility filtering but with filtering out the downtrends (LEI ROC(6) > -2%), for more, see Market Regimes Filtering.
The top chart represents the “overbought” regime with RSI(14) > 70, the bottom one is for the rangebound regime with RSI(14) bounded by the 50-60 range.
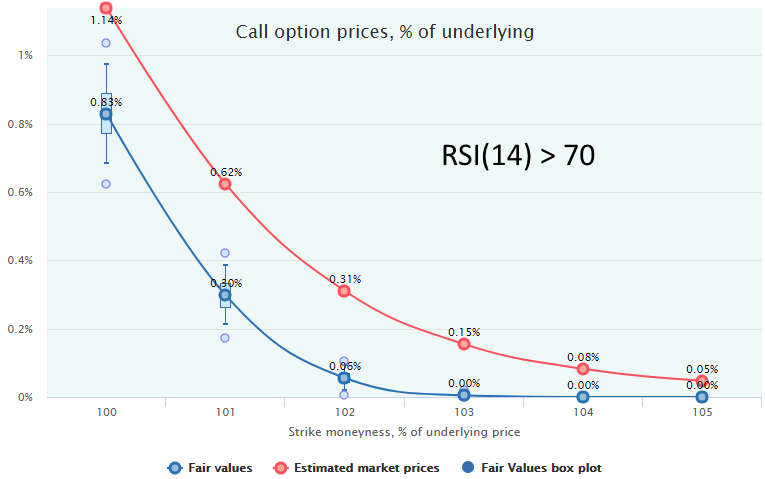
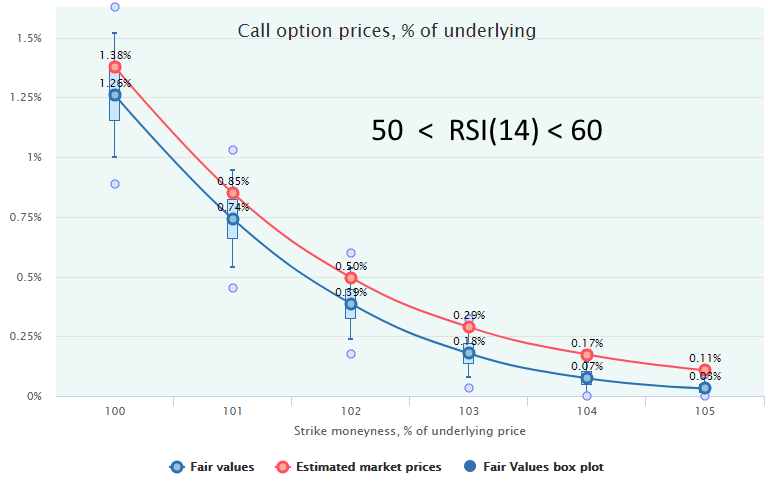
In both cases, we see that the call options are overpriced by the market, and selling them would be a profitable strategy. However, when the market is overbought (RSI>70) the expected profit is much more statistically significant than in the rangebound regime (RSI 50-60) when the market price line lies very close to the Fair Values and, in some cases, within the bodies of box-plots. In this, second case, the profit from the calls selling will realize with much less probability and/or after more number of trades; therefore, a more conservative approach is advisable: either reduce the trade size or refrain from trading at all.
Quantiles and Confidence Intervals can be calculated by the two classes of methods: analytical, with some formula, and numerical, with the help of computer power via the “brute force” of the large number of random resampling iterations (bootstrapping).
To find quantiles and confidence intervals, it is possible to apply the mathematical concept called the Central Limit Theorem asserting the following:
the sums (and, hence, mean values) of outcomes of a sufficiently large number of realizations of any random variable will have the distribution close to normal, regardless of the type of distribution of this variable.
Actually, the Fair Value is also a mean of some distribution. This is an expected payoff of an options contract at expiration (all possible values weighted by probability) and, according to the Central Limit Theorem, this value will tend to be more normally distributed with more iteration.
What we do in the Fair Value calculation is actually taking some historical sample of returns of the underlying security and calculating another sample of hypothetical options values at expiration corresponding to each underlying price, with the help of payoff function. The average value (the mean) of this second sample is our Fair Value of an option contract.
If we repeat this experiment many times in future with the same random variable — underlying returns — or select many random subsamples from the past, we will get some set of Fair Values calculated based on each of those subsamples. The theory states that all these Fair Values will be almost normally distributed.
Moreover, this theory gives us the formulas for the mean and standard deviation of that normal distribution. Its mean value is equal to the mean of the initial sample (initial Fair Value in our case), and its standard deviation, also known as Standard Error of mean, has the following formula:

σs – standard deviation of our initial sample
n – number of items in subsamples
As a σs for the Fair Values, we take the standard deviation of the options payoffs in the past within the Filter Bin: MAX(0, S-X) for calls and MAX(0, X-S) for puts.
The choice of the subsamples size (n) is not an easy task (click to expand).
In the simplest form, it would be equal to the actual number of the historical data points on the basis of which the Fair Values have been calculated – the size of the Filter Bin. However, that would mean that we calculate the confidence intervals that are expected to realize in this, cometimes quite large, number of future iterations (trades).
For example, if we have 400 dates in a Filter Bin for the Fair Values calculation and use this number as n parameter in the Standard Error formula, we will have to make 400 trades in the future until our probability estimations realize. That is not practical, of course, and that number must be much less and somehow close to the feasible number of future trades.
Anyway, this parameter is inversely proportional to the width of the confidence intervals with the square root (see the formula above). More conservative approach would dictate the usage of the smaller number. As a rule of thumb, in the OptionSmile platform, it has 100 as a default value that can be easily changed by a user.
Finally, having the Standard Error estimated, it is easy to calculate any quantile and confidence interval for the Fair Value. It is actually a standard deviation of the normal distribution with the Fair Value as a mean, and the analytical formula of probability distribution functions for a normal distribution is known.
Here are the quantiles used in the OptionSmile platform with the corresponding numbers of Standard Errors (SE) standing out from the mean – point estimation of the Fair Value.
|
Quantile |
Distance from the mean (in SEs) |
|
1% |
-2.33 |
|
5% |
-1.64 |
|
25% |
-0.67 |
|
50% |
0.00 |
|
75% |
0.67 |
|
99% |
2.33 |
The numerical method is another way to find the confidence intervals of Fair Value – without analytical formulas, i.e., with a method called Bootstrapping.
This so-called “resampling” technique consists of the following steps:
This method does not rely on the theory such as the Central Limit Theorem and derives probabilities directly from the underlying returns dataset. It is more demanding for the computation resources while producing almost the same result as the analytical formula. That is why the OptionSmile platform utilizes the analytical approach.
Read Next: Fair Value of Option Strategies