Can past data be a reliable source for the future? Out-of-sample test for Fair Values validity.
Can past data be a reliable source for the future? Out-of-sample test for Fair Values validity.
Puts are systematically overpriced but provide a cushion against volatility. Can they improve the total compounded return?
How would the Fair Values and “volatility smile” of hypothetical Bitcoin options look like?
Calls selling in Bull Markets has negative expected profit. Is there a way to make Covered Calls efficient?
Selling puts on equity indices are very profitable on average. But high volatility with huge negative “fat tails” makes it not so attractive
VXX is an ETP designed for VIX exposure. But due to contango in VIX futures, its value is constantly diminishing. Does that make puts attractive?
Calls on equity indices are fairly priced on average. Selling them adds nothing to the portfolio expected profit but decreases its volatility.
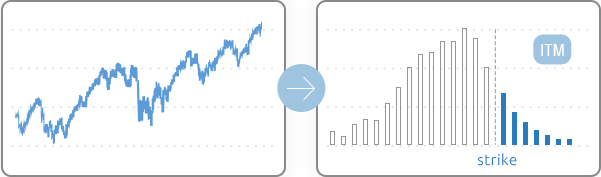
OptionSmile is an online software platform that utilizes the historical distribution of underlying security returns to find an option Fair Value - a price at which both buyer and seller have zero expected profit, net of transaction costs.
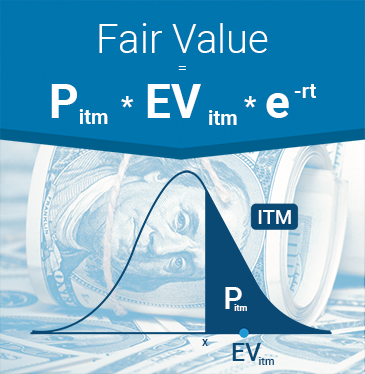
It equals to the probability of expiration “in-the-money” (Pitm) multiplied by the expected value of the contract in case of such expiration (EVitm) and discounted to get a present value (e-rt).
It is a model-free (non-parametric) approach.
Fair Values are based on the underlying security distribution and do nothing with the option traders views on volatility and probabilities. This is an objective historical “reality”.
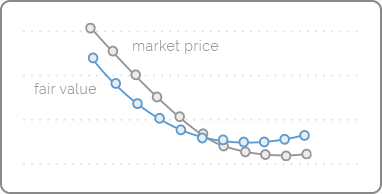
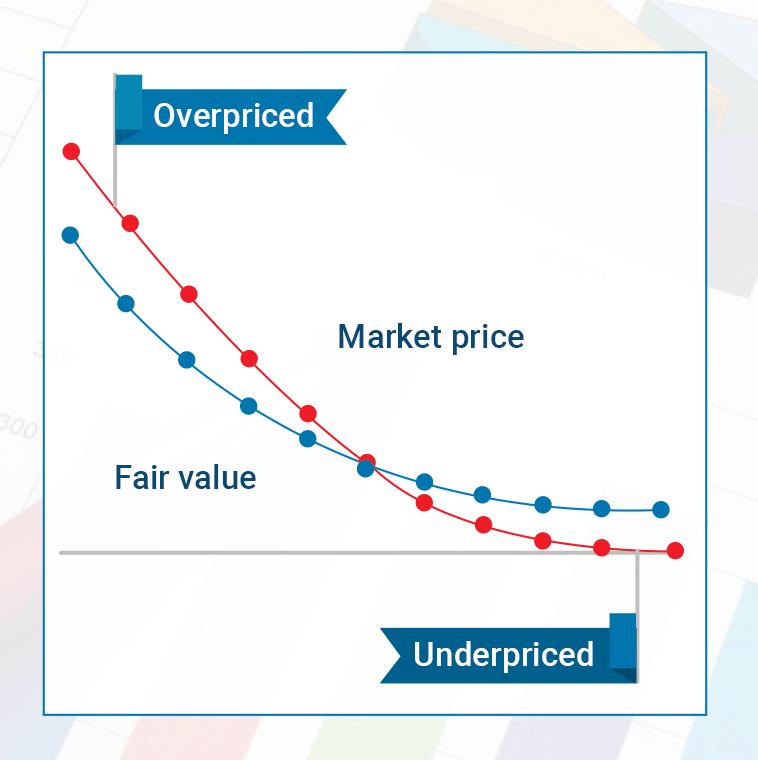
By comparing the Fair Value and the Market Price, we find out if an option contract is overestimated or underestimated by the market.
Market prices can be taken from the current moment to calculate a real-time mispricing or from the historical option quotes to discover the regimes with systematic mispricing in the past.

Fair Value is essentially the mathematically expected payoff at expiration: all possible outcomes weighted by their probabilities.
Since it is a probabilistic estimation, we have not just one Fair Value number but its whole distribution. With different quantiles - 1%, 5%, 25%, 50%, 75%, 95%, and 99% - we build the confidence intervals for the Fair Value, in which it gets with certain probability: 98%, 90%, and 50%.
With the representation of “box-plots”, they provide an estimation of the statistical significance of market mispricing.
The market lives in regimes when it behaves differently and demonstrates specific character. In each of these regimes, options Fair Values vary substantially.
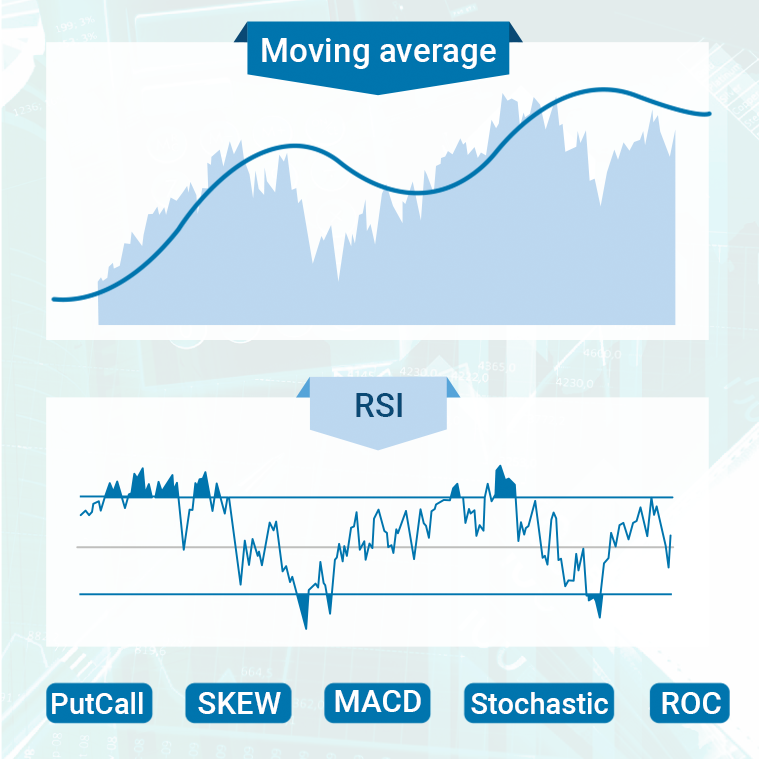
We apply different indices and indicators to easily spot the distinct regimes with specific patterns and calculate Fair Values and mispricing for the selected regime or time period.
Filtering indicators can be various: macroeconomic, volatility, technical, etc. We automatically calculate their real-time values and selects from the past only those dates that resemble the current market condition - for the Fair Values calculation.
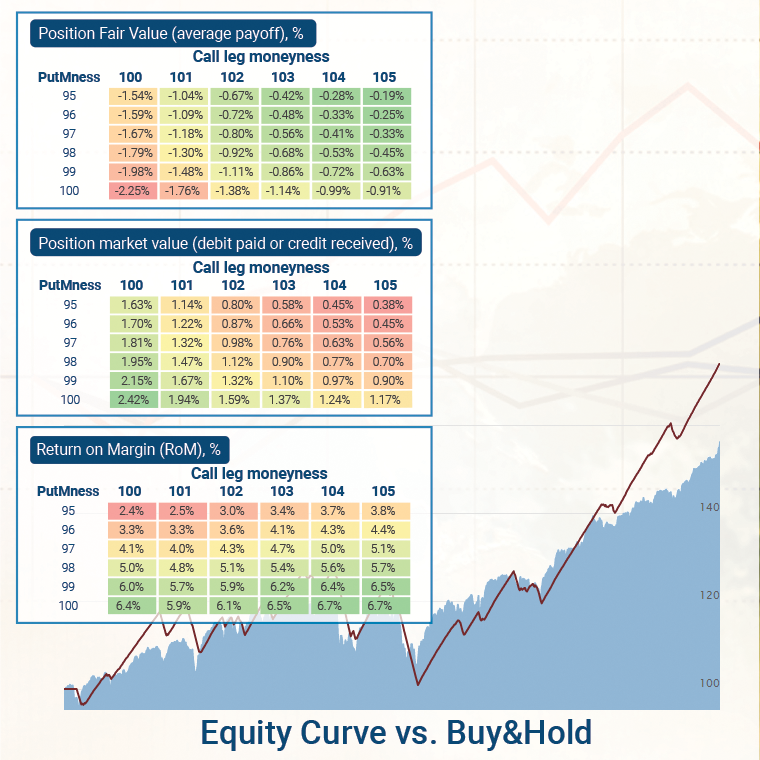
The OptionSmile platform can calculate Fair Values of multileg option strategies and, by comparing them with the market prices, find a mispricing.
Strategy metrics are not limited to the expected profit/loss and represent a full dashboard of performance indicators such as distribution histogram, margins, standard deviation, Sharpe/Sortino ratios, tail risk, optimal position sizing, equity lines and more.
As with a single contract, the strategy efficiency can be measured against either real-time or historical market prices.
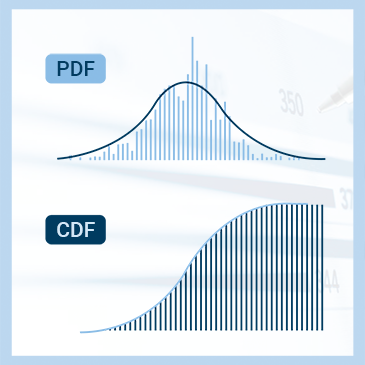
The market regimes filtering can be applied not just for trading options but for the linear assets as well. OptionSmile platform produces various statistics of the underlying security returns.
Mean return, standard deviation, Sharpe ratio, Implied-to-Realized volatility, statistical significance tests, probability density, and cumulative distribution charts of underlying returns. All that is a valuable by-product of the options Fair Value calculation.